Explore re-projected dataset in the Med cube
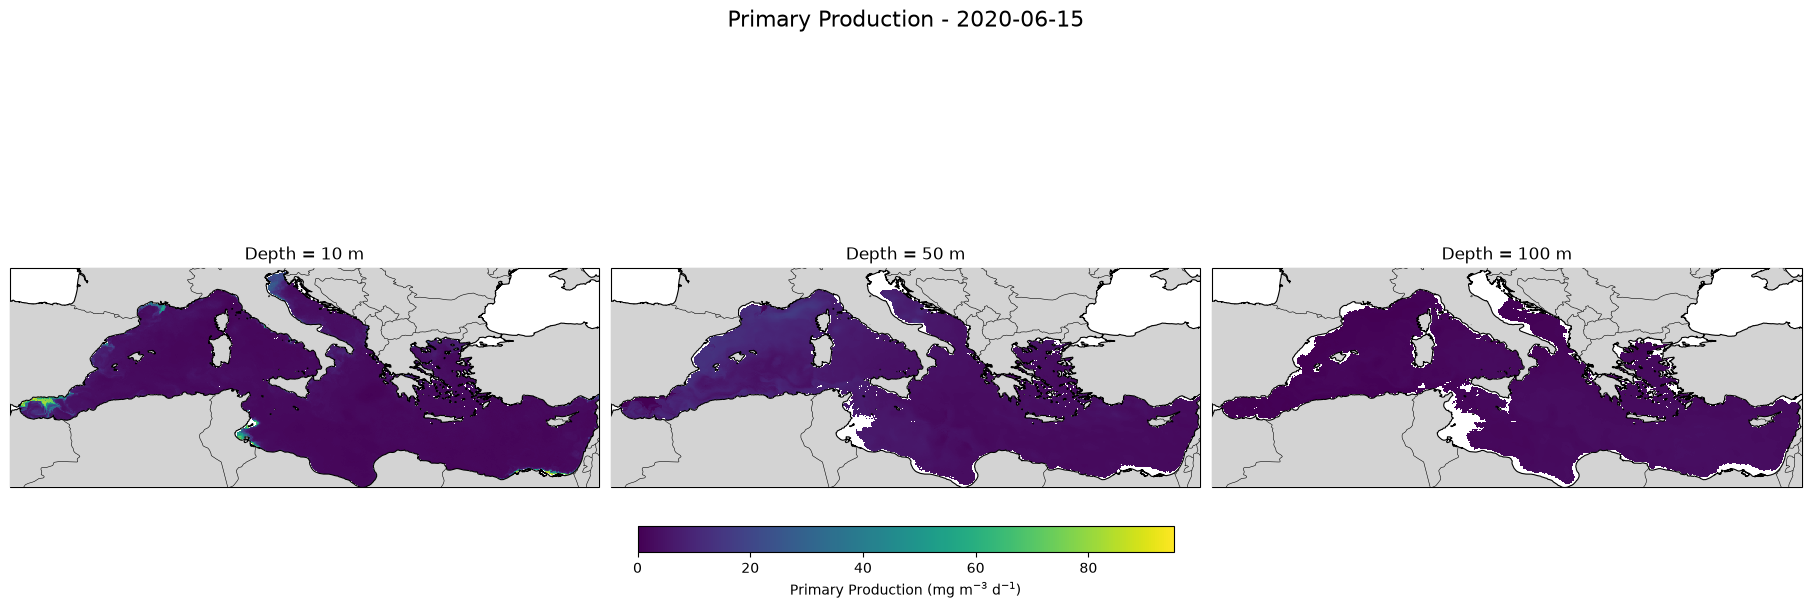
Dataset with Primary Production field estimated from chlorophyll and temperature 3D fields (spatial resolution = 1/24 deg), and Euphotic Depth Estimaded by PP model.
Original Data Source: https://
4dmed .artov .ismar .cnr .it /thredds /catalog /4dmed /catalog _PP .html Reference: https://
4dmed .artov .ismar .cnr .it /thredds /catalog /4dmed /catalog _PP .html OSC entry: https://
opensciencedata .esa .int /products /4dmed -3d -prim -prod -150 /collection License: CC-BY-4.0
import xarray as xr
from pystac_client import Client

catalog = Client.open("https://eoapi.workspace.earthcode.eox.at/stac/")
item = next(catalog.search(collections=["4dmed-3d-prim-prod-150"]).items())
item
Loading...
item.assets["data"].hrefds = xr.open_zarr(item.assets["data"].href)
dsLoading...
import numpy as np
import matplotlib.pyplot as plt
import cartopy.crs as ccrs
import cartopy.feature as cfeature

# -----------------------------
# Settings
# -----------------------------
date = "2020-06-15"

# Depth coordinates in your dataset are negative
depths = [-10, -50, -100]   # metres

# -----------------------------
# Select data
# -----------------------------
pp = ds["PP"].sel(
    time=date,
    method="nearest"
)

# Select nearest available depths
pp_depths = [
    pp.sel(depth=d, method="nearest")
    for d in depths
]

# Load only these three 2-D slices into memory
pp_depths = [x.compute() for x in pp_depths]

# Actual date selected
actual_date = np.datetime_as_string(
    pp_depths[0].time.values,
    unit="D"
)

# Using the same scale makes the depths directly comparable
vmin = min(float(x.min(skipna=True)) for x in pp_depths)
vmax = max(float(x.max(skipna=True)) for x in pp_depths)
fig, axes = plt.subplots(
    1, 3,
    figsize=(18, 6),
    subplot_kw={"projection": ccrs.PlateCarree()},
    constrained_layout=True
)

for ax, data, requested_depth in zip(
    axes,
    pp_depths,
    depths
):
    actual_depth = float(data.depth.values)

    pcm = ax.pcolormesh(
        ds["lon"],
        ds["lat"],
        data,
        transform=ccrs.PlateCarree(),
        shading="auto",
        cmap="viridis",
        vmin=vmin,
        vmax=vmax
    )

    # Basemap
    ax.add_feature(
        cfeature.LAND,
        facecolor="lightgray",
        zorder=10
    )

    ax.coastlines(
        resolution="10m",
        linewidth=0.8,
        zorder=11
    )

    ax.add_feature(
        cfeature.BORDERS,
        linewidth=0.4,
        zorder=11
    )

    # Mediterranean extent from dataset
    ax.set_extent(
        [
            float(ds.lon.min()),
            float(ds.lon.max()),
            float(ds.lat.min()),
            float(ds.lat.max())
        ],
        crs=ccrs.PlateCarree()
    )

    ax.set_title(
        f"Depth = {abs(actual_depth):.0f} m"
    )

cbar = fig.colorbar(
    pcm,
    ax=axes,
    orientation="horizontal",
    fraction=0.06,
    pad=0.08
)

cbar.set_label(
    r"Primary Production (mg m$^{-3}$ d$^{-1}$)"
)

fig.suptitle(
    f"Primary Production - {actual_date}",
    fontsize=16
)

plt.show()