Explore re-projected dataset in the Med cube
The BICEP database contains multiple datasets combined into four zarr stores:
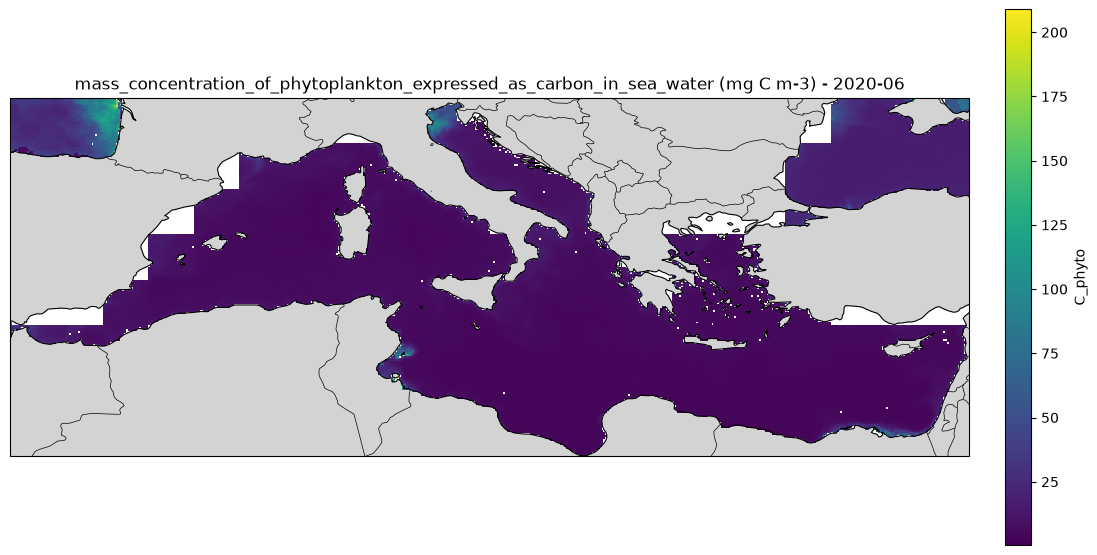
bicep_marine_primary_productivity.zarr - This dataset contains monthly global carbon products for pico-, nano- and microphytoplankton (C_picophyto, C_nanophyto and C_microphyto, respectively, in mg C m-3) and the total phytoplankton community (C_phyto in mg C m-3) for the period of 1997 to 2020 at 9 km spatial resolution
bicep_oceanic_export_production.zarr - Monthly global data for Oceanic Export Production
particulate_organic_carbon_geo.zarr - Particulate Inorganic Carbon (PIC) data
phytoplankton_carbon.zarr - This dataset contains monthly global carbon products for pico-, nano- and microphytoplankton (C_picophyto, C_nanophyto and C_microphyto, respectively, in mg C m-3) and the total phytoplankton community (C_phyto in mg C m-3) for the period of 1998 to 2020 at 9 km spatial resolution.
EO4SOCIETY Website: https://
eo4society .esa .int /projects /bicep/ Original Data Source: https://
data .ceda .ac .uk /neodc /bicep /data Reference: https://
opensciencedata .esa .int /projects /biological -pump -and -carbon -exchange -processes /collection OSC entry: https://
opensciencedata .esa .int /projects /biological -pump -and -carbon -exchange -processes /collection , https:// opensciencedata .esa .int /products /bicep -database /collection .json License: Open Data License (UK Gov)
import xarray as xrfrom pystac_client import Client
catalog = Client.open("https://eoapi.workspace.earthcode.eox.at/stac/")
collection = catalog.search(collections=["bicep-database"]).item_collection()
items = {item.id: item for item in collection}
collection[item.assets["data"].href for item in collection]ds = xr.open_zarr(items["bicep-database-particulate_organic_carbon_geo"].assets["data"].href)
dsmarine primary productivity
ds = xr.open_zarr(items["bicep-database-marine_primary_productivity"].assets["data"].href)
dsimport matplotlib.pyplot as plt
import cartopy.crs as ccrs
import cartopy.feature as cfeature
import numpy as np
# Choose date
date = "2020-06"
# Select FSLE for that date
pp = ds["pp"].sel(time=np.datetime64(date), lon=slice(-6.062, 36.06), lat=slice(30.27, 45.98), drop=True)
# 2-D coordinates
lon = pp["lon"]
lat = pp["lat"]
# Create map
fig = plt.figure(figsize=(12, 7))
ax = plt.axes(projection=ccrs.PlateCarree())
# Plot FSLE
pcm = ax.pcolormesh(
lon,
lat,
pp,
transform=ccrs.PlateCarree(),
shading="auto",
cmap="viridis"
)
# Basemap features
ax.add_feature(cfeature.LAND, facecolor="lightgray")
ax.add_feature(cfeature.COASTLINE, linewidth=0.8)
ax.add_feature(cfeature.BORDERS, linewidth=0.5)
# Colourbar
cbar = plt.colorbar(
pcm,
ax=ax,
orientation="vertical",
pad=0.03,
shrink=0.8
)
cbar.set_label("PP")
ax.set_title(f"gross_primary_production_of_carbon (mg C m-2 d-1) - {date}")
plt.tight_layout()
plt.show()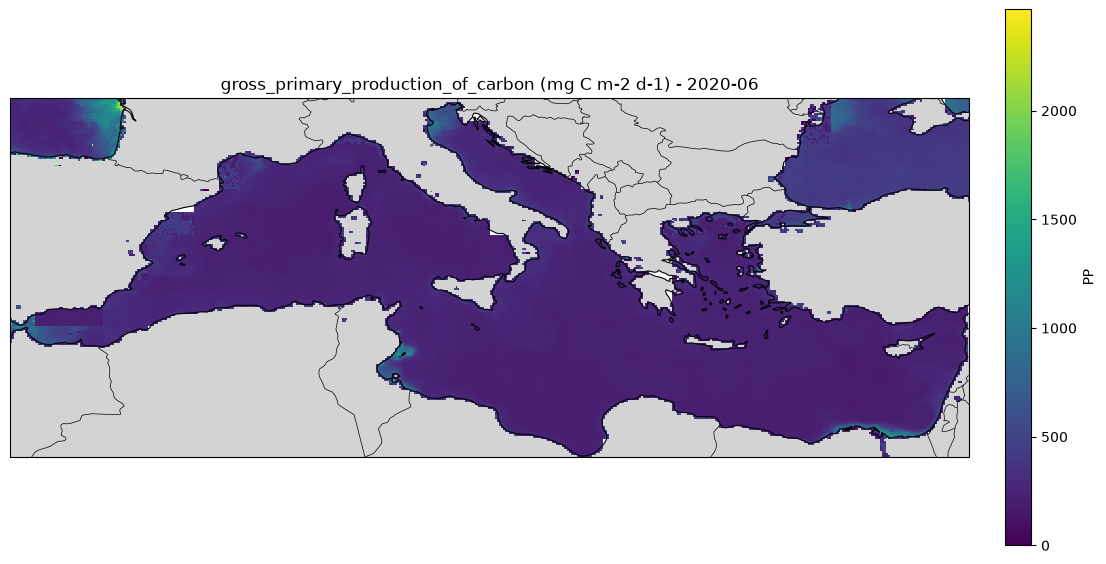
Export Productivity
ds = xr.open_zarr(items["bicep-database-oceanic_export_production"].assets["data"].href)
dsimport matplotlib.pyplot as plt
import cartopy.crs as ccrs
import cartopy.feature as cfeature
# Select June 2016
ds_june = ds.sel(time="2020-06", method='nearest')
variables = ["EP_Dunne", "EP_Henson", "EP_Li"]
fig, axes = plt.subplots(
nrows=3,
ncols=1,
figsize=(12, 12),
subplot_kw={"projection": ccrs.PlateCarree()},
constrained_layout=True
)
for ax, var in zip(axes, variables):
da = ds_june[var]
im = ax.pcolormesh(
ds_june.lon,
ds_june.lat,
da,
transform=ccrs.PlateCarree(),
shading="auto",
cmap="viridis"
)
ax.coastlines()
ax.add_feature(cfeature.LAND, facecolor="lightgray")
ax.set_global()
ax.set_title(
f"{da.attrs.get('description', var)} - June 2016",
fontsize=12
)
cbar = fig.colorbar(
im,
ax=ax,
orientation="vertical",
pad=0.02,
shrink=0.8
)
cbar.set_label("mg C m$^{-2}$ d$^{-1}$")
plt.show()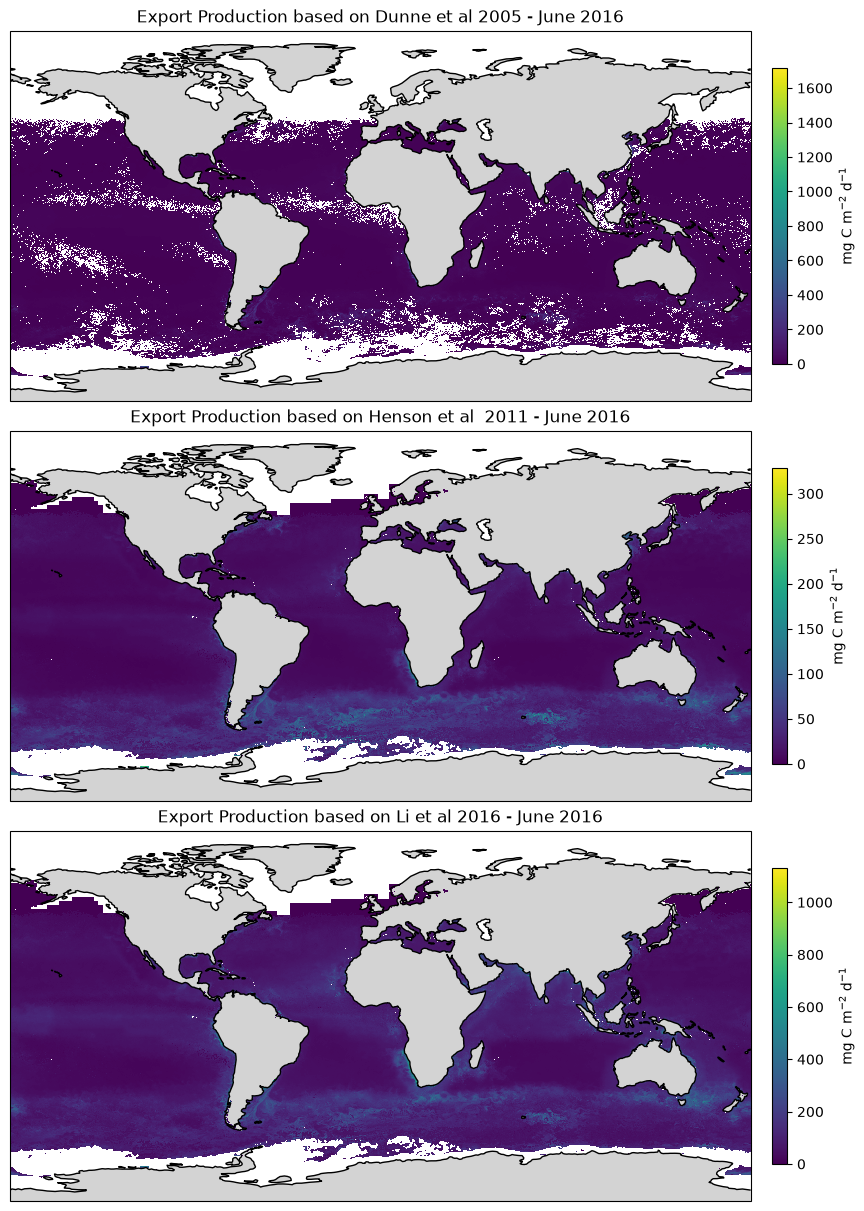
particulate_organic_carbon_geo
ds = xr.open_zarr(items["bicep-database-particulate_organic_carbon_geo"].assets["data"].href)
dsimport matplotlib.pyplot as plt
import cartopy.crs as ccrs
import cartopy.feature as cfeature
import numpy as np
# Choose date
date = "2020-06"
# Select FSLE for that date
pp = ds["POC"].sel(time=np.datetime64(date), lon=slice(-6.062, 36.06), lat=slice(45.98, 30.27,), drop=True)
# 2-D coordinates
lon = pp["lon"]
lat = pp["lat"]
# Create map
fig = plt.figure(figsize=(12, 7))
ax = plt.axes(projection=ccrs.PlateCarree())
# Plot FSLE
pcm = ax.pcolormesh(
lon,
lat,
pp,
transform=ccrs.PlateCarree(),
shading="auto",
cmap="viridis"
)
# Basemap features
ax.add_feature(cfeature.LAND, facecolor="lightgray")
ax.add_feature(cfeature.COASTLINE, linewidth=0.8)
ax.add_feature(cfeature.BORDERS, linewidth=0.5)
# Colourbar
cbar = plt.colorbar(
pcm,
ax=ax,
orientation="vertical",
pad=0.03,
shrink=0.8
)
cbar.set_label("Particulate Organic Carbon")
ax.set_title(f"Particulate Organic Carbon (mg m^-3) - {date}")
plt.tight_layout()
plt.show()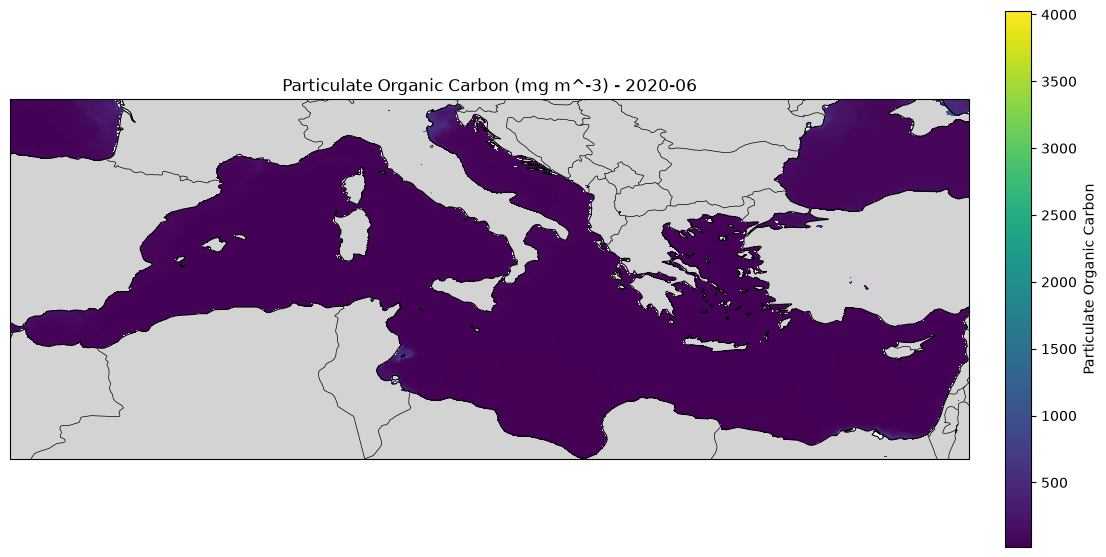
phytoplankton_carbon
ds = xr.open_zarr(items["bicep-database-phytoplankton_carbon"].assets["data"].href)
dsimport matplotlib.pyplot as plt
import cartopy.crs as ccrs
import cartopy.feature as cfeature
import numpy as np
# Choose date
date = "2020-06"
# Select FSLE for that date
pp = ds["C_phyto"].sel(time=np.datetime64(date), lon=slice(-6.062, 36.06), lat=slice(30.27,45.98), drop=True)
# 2-D coordinates
lon = pp["lon"]
lat = pp["lat"]
# Create map
fig = plt.figure(figsize=(12, 7))
ax = plt.axes(projection=ccrs.PlateCarree())
# Plot FSLE
pcm = ax.pcolormesh(
lon,
lat,
pp,
transform=ccrs.PlateCarree(),
shading="auto",
cmap="viridis"
)
# Basemap features
ax.add_feature(cfeature.LAND, facecolor="lightgray")
ax.add_feature(cfeature.COASTLINE, linewidth=0.8)
ax.add_feature(cfeature.BORDERS, linewidth=0.5)
# Colourbar
cbar = plt.colorbar(
pcm,
ax=ax,
orientation="vertical",
pad=0.03,
shrink=0.8
)
cbar.set_label("C_phyto")
ax.set_title(f"mass_concentration_of_phytoplankton_expressed_as_carbon_in_sea_water (mg C m-3) - {date}")
plt.tight_layout()
plt.show()