Description: The change in surface elevation of the Antarctic grounded ice sheet is measured from all available ESA Radar Altimetry missions (ERS-1, ERS-2, ENVISAT, CryoSat-2, Sentinel-3A, and Sentinel-3B) from 1991 to 2021.
Original Data Source: https://
www .cpom .ucl .ac .uk /csopr /icesheets2 /index .php Reference: Shepherd et al. (2019), https://
climate .esa .int /en /projects /ice -sheets -antarctic/ OSC entry: https://
opensciencedata .esa .int /products /sec -antarctic -ice -sheet /collection License: cc-by-4.0
Repo Folder: ./datasets/sec
import xarray as xr
import numpy as np
import matplotlib.pyplot as plt
import warnings

warnings.filterwarnings("ignore", message="Polyfit may be poorly conditioned")
warnings.filterwarnings("ignore", message="invalid value encountered in cast", category=RuntimeWarning)
url = 'https://s3.waw4-1.cloudferro.com/EarthCODE/OSCAssets/polar_cube_datasets/surface_elevation/ESACCI-AIS-L3C-SEC-MULTIMISSION-5KM-5YEAR-MEANS-1991-2021-fv1.zarr/'ds = xr.open_zarr(url)
dsLoading...
# compute surface evelavtion change trend
sec = ds.sec.where(ds.surface_type == 2)
unc = ds.sec_uncertainty.where(ds.surface_type == 2)

t = (ds.time.dt.year + (ds.time.dt.dayofyear - 1) / 365.25)
t = t - t.mean()

sec_y = sec.assign_coords(year=("time", ds.time.dt.year.values))
trend = sec_y.swap_dims({"time": "year"}).polyfit("year", 1).polyfit_coefficients.sel(degree=1)
trend = trend * 1000   # mm yr-2, change in SEC rate per year
mean_sec = sec.mean("time") * 1000
mean_unc = unc.mean("time") * 1000
signal_to_noise = abs(mean_sec) / mean_unc
mean_sec = mean_sec.where(signal_to_noise <= 2)fig, ax = plt.subplots(figsize=(9, 8))
im = ax.pcolormesh(
ds.x / 1000, ds.y / 1000, mean_sec,
shading="auto", cmap="RdBu", vmin=-500, vmax=500
)
trend_for_contour = trend.where(np.isfinite(mean_sec))
trend_for_contour = trend_for_contour.rolling(x=9, y=9, center=True, min_periods=41).mean()
trend_for_contour = trend_for_contour.where(np.isfinite(mean_sec))
contour = ax.contour(
ds.x / 1000, ds.y / 1000, trend_for_contour,
levels=[-16, -8, 8, 16],
colors="k", linewidths=0.5, alpha=0.75, zorder=3
)
ax.set_aspect("equal")
ax.set_title("Antarctic surface elevation change fingerprint\nmean SEC with acceleration contours and SNR<2 boundary")
ax.set_xlabel("Polar stereographic x (km)")
ax.set_ylabel("Polar stereographic y (km)")
cb = plt.colorbar(im, ax=ax, shrink=0.8)
cb.set_label("Mean surface elevation change, 1991–2022 5-year windows (mm/yr)")
plt.show()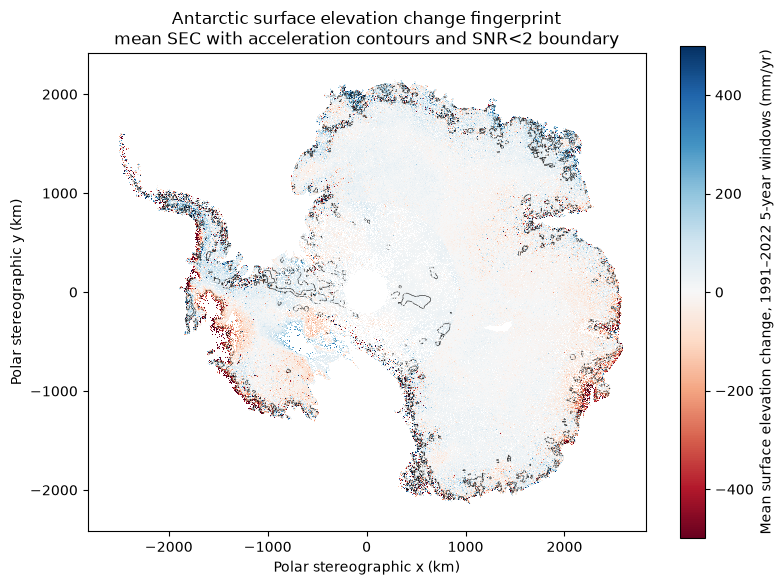
Group by IBIE basin ID
ds.basin_idLoading...
basin = ds.basin_id.where(ds.surface_type == 2).load()

basin_summary = xr.Dataset({
    "mean_sec_mm_yr": mean_sec.groupby(basin).mean(),
    "trend_mm_yr2": trend.groupby(basin).mean(),
    "mean_unc_mm_yr": mean_unc.groupby(basin).mean(),
    "snr": signal_to_noise.groupby(basin).mean()
})

group_dim = list(basin_summary.dims)[0]

df = (
    basin_summary
    .rename({group_dim: "basin_id"})
    .sel(basin_id=np.arange(1, 28))
    .to_dataframe()
    .reset_index()
)

df
Loading...
# create a geopandas frame for the basins
import xarray as xr
import numpy as np
import pandas as pd
import geopandas as gpd
import matplotlib.pyplot as plt

from affine import Affine
from rasterio.features import shapes
from shapely.geometry import shape
from pyproj import CRS
# generate polygons from the raster based on basin id
crs = CRS.from_wkt(ds.grid_projection.attrs["crs_wkt"])
basin = ds.basin_id.where(ds.surface_type == 2).load().astype("int16")
basin_arr = basin.values
x = ds.x.values
y = ds.y.values
dx = float(np.abs(x[1] - x[0]))
dy = float(np.abs(y[1] - y[0]))
transform = Affine.translation(x[0] - dx / 2, y[0] - dy / 2) * Affine.scale(dx, dy)
records = [
{"basin_id": int(v), "geometry": shape(g)}
for g, v in shapes(basin_arr, mask=(basin_arr > 0), transform=transform)
if int(v) > 0
]
basin_gdf = gpd.GeoDataFrame(records, crs=crs).dissolve(by="basin_id").reset_index()
basin_gdf["basin_id"] = basin_gdf["basin_id"].astype(int)
df["basin_id"] = df["basin_id"].astype(int)
basin_map = basin_gdf.merge(df, on="basin_id", how="left")
basin_map.head()Loading...
from matplotlib.colors import TwoSlopeNorm


v = basin_map["mean_sec_mm_yr"]
lim = np.nanmax(np.abs(v))

norm = TwoSlopeNorm(vmin=-lim, vcenter=0, vmax=lim)

fig, ax = plt.subplots(figsize=(9, 8))

basin_map.plot(
    column="mean_sec_mm_yr",
    ax=ax,
    cmap="RdBu_r",
    norm=norm,
    legend=True,
    legend_kwds={
        "label": "Mean surface elevation change by basin (mm/yr)",
        "shrink": 0.75
    },
    edgecolor="black",
    linewidth=0.4,
    missing_kwds={"color": "lightgrey", "label": "No data"}
)

for _, r in basin_map.iterrows():
    p = r.geometry.representative_point()
    ax.text(p.x, p.y, int(r.basin_id), ha="center", va="center", fontsize=7)


ax.set_aspect("equal")
ax.set_axis_off()
ax.set_title("Antarctic drainage-basin mean surface elevation change")

plt.show()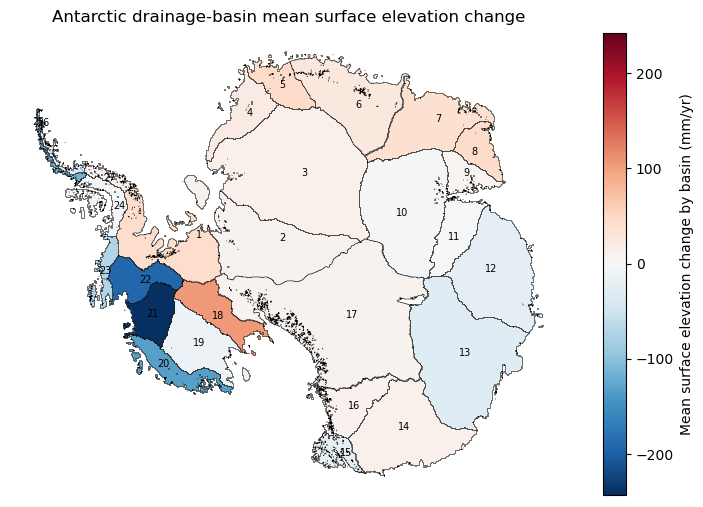
- Shepherd, A., Gilbert, L., Muir, A. S., Konrad, H., McMillan, M., Slater, T., Briggs, K. H., Sundal, A. V., Hogg, A. E., & Engdahl, M. E. (2019). Trends in Antarctic Ice Sheet Elevation and Mass. Geophysical Research Letters, 46(14), 8174–8183. 10.1029/2019gl082182