Description: Antarctic ice shelf basal melt rates from 1997 to 2021. All code required to reproduce the results presented in Davison et al. Annual mass budget of Antarctic ice shelves from 1997 to 2021. Also provided are the ice shelf masks and 500x500 m basal melt rates.
Original Data Source: https://
zenodo .org /records /8052519 Reference: Davison et al. (2023)
OSC entry: https://
opensciencedata .esa .int /products /antarctic -ice -shelf -melt -rates /collection License: CC-BY-4.0
Repo Folder: ./datasets/basal_melt
from pathlib import Path

import geopandas as gpd
import matplotlib.dates as mdates
import matplotlib.pyplot as plt
import numpy as np
import pandas as pd
import rasterio
from matplotlib.patches import Rectangle
from mpl_toolkits.axes_grid1.inset_locator import inset_axes
from rasterio.windows import from_bounds
import xarray as xr
import rioxarray as rxr


# use remote paths
raster_path = Path("https://s3.waw4-1.cloudferro.com/EarthCODE/OSCAssets/polar_cube_datasets/basal_melt/basal_melt_map_racmo_firn_air_corrected.tif")

bucket = 's3://EarthCODE/'
endpoint_url = "https://s3.waw4-1.cloudferro.com"
region_name = "eu-west-2"
file = 'OSCAssets/polar_cube_datasets/basal_melt/basal_melt_timeseries_polygons_union_and_intersection.parquet'
gdf = gpd.read_parquet(
    f"{bucket}{file}",
    storage_options={ "anon": True,
                    "client_kwargs": {
                        "endpoint_url": endpoint_url,
                        "region_name": region_name
                    }
    }
).set_geometry("geometry_union")
# select shelf to plot
shelf_name = "Aviator"# read shelf melt time series
# gdf = gpd.read_parquet(parquet_path)
gdf["time"] = pd.to_datetime(gdf["time"])
shelf = gdf[gdf.name.str.casefold() == shelf_name.casefold()].sort_values("time").copy()
# create masks for the target and all other shelves
all_masks = gdf[["name", "geometry_union"]].drop_duplicates("name")
outline = shelf[["name", "geometry_union"]].drop_duplicates("name")Simple xr-rasterio plot
rxr.open_rasterio(raster_path, chunks={}).sel(band=1).rio.clip(outline.geometry_union, outline.crs).plot()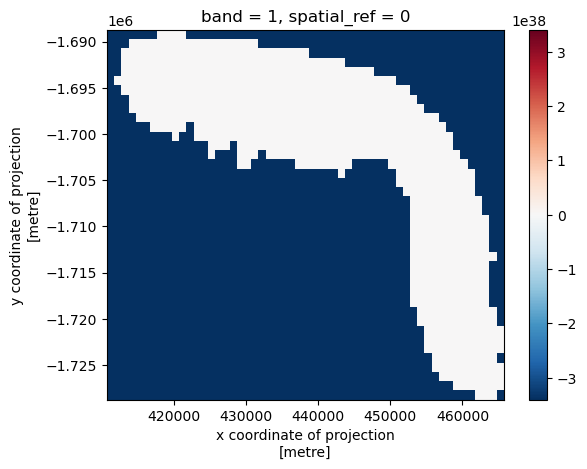
Reproducing Original Paper’s Charts
Schmidt, G. A., Mankoff, K. D., Bamber, J. L., Burgard, C., Carroll, D., Chandler, D. M., Coulon, V., Davison, B. J., England, M. H., Holland, P. R., Jourdain, N. C., Li, Q., Marson, J. M., Mathiot, P., McMahon, C. R., Moon, T. A., Mottram, R., Nowicki, S., Olivé Abelló, A., Pauling, A. G., Rackow, T., and Ringeisen, D.: Datasets and protocols for including anomalous freshwater from melting ice sheets in climate simulations, Geoscientific Model Development, 18, 8333-8361, Schmidt et al. (2025), 2025.
# open raster and read the data around a target shelf
with rasterio.open(raster_path) as src:
    all_masks = all_masks.to_crs(src.crs)
    outline = outline.to_crs(src.crs)
    x0, y0, x1, y1 = outline.total_bounds
    dx, dy = (x1 - x0) * 0.25, (y1 - y0) * 0.25
    x0 = max(x0 - dx, src.bounds.left)
    y0 = max(y0 - dy, src.bounds.bottom)
    x1 = min(x1 + dx, src.bounds.right)
    y1 = min(y1 + dy, src.bounds.top)
    win = from_bounds(x0, y0, x1, y1, src.transform).round_offsets().round_lengths()
    melt = np.ma.masked_invalid(src.read(1, window=win, masked=True).astype(float))
    l, b, r, t = rasterio.windows.bounds(win, src.transform)

# limit the values
vals = melt.compressed()
if vals.size and vals.min() < 0 < vals.max():
    lim = np.nanpercentile(np.abs(vals), 98)
    cmap, vmin, vmax = "RdBu_r", -lim, lim
else:
    cmap = "magma"
    vmin = np.nanpercentile(vals, 2) if vals.size else None
    vmax = np.nanpercentile(vals, 98) if vals.size else None
# plot data the shelf, the firn rate basal melt, and the time series
fig, (ax_map, ax_ts) = plt.subplots(1, 2, figsize=(14, 5), gridspec_kw={"width_ratios": [1.4, 2.2]}, constrained_layout=True)
all_masks.plot(ax=ax_map, color="0.85", edgecolor="none")
outline.plot(ax=ax_map, color="#3182bd", edgecolor="black", linewidth=0.7)
ax_map.add_patch(Rectangle((x0, y0), x1 - x0, y1 - y0, fill=False, edgecolor="#d95f0e", linewidth=1.2))
ax_map.set_title("Antarctica")
ax_map.set_axis_off()
inset = inset_axes(ax_map, width="46%", height="46%", loc="upper right", borderpad=1)
im = inset.imshow(melt, extent=(l, r, b, t), origin="upper", cmap=cmap, vmin=vmin, vmax=vmax)
outline.plot(ax=inset, facecolor="none", edgecolor="white", linewidth=1.2)
inset.set_xlim(x0, x1)
inset.set_ylim(y0, y1)
inset.set_xticks([])
inset.set_yticks([])
inset.set_title(shelf_name, fontsize=9)
fig.colorbar(im, ax=ax_map, fraction=0.04, pad=0.02, label="Basal melt")
ax_map.text(
0.03,
0.05,
f"Name: {shelf_name}\nAnnual masks: {shelf.time.dt.year.nunique()}\nMean BM rate: {shelf.bm_yearly.mean():.2f}\nMean area: {shelf.area_km2.mean():,.0f} km$^2$",
transform=ax_map.transAxes,
ha="left",
va="bottom",
fontsize=9,
bbox=dict(boxstyle="round,pad=0.35", facecolor="white", edgecolor="0.5", alpha=0.95),
)
ax_ts.fill_between(shelf.time, shelf.bm_monthly - shelf.bm_monthly_errors, shelf.bm_monthly + shelf.bm_monthly_errors, color="0.75", alpha=0.5, linewidth=0)
ax_ts.plot(shelf.time, shelf.bm_monthly, color="black", linewidth=1.0, label="Monthly")
ax_ts.fill_between(shelf.time, shelf.bm_yearly - shelf.bm_yearly_errors, shelf.bm_yearly + shelf.bm_yearly_errors, color="#9ecae1", alpha=0.35, linewidth=0)
ax_ts.plot(shelf.time, shelf.bm_yearly, color="#2171b5", linewidth=2.0, label="Yearly")
ax_ts.set_title(f"{shelf_name} basal melt")
ax_ts.set_ylabel("Basal melt")
ax_ts.xaxis.set_major_locator(mdates.YearLocator(2))
ax_ts.xaxis.set_major_formatter(mdates.DateFormatter("%Y"))
ax_ts.grid(True, alpha=0.25)
ax_ts.legend(loc="best", frameon=False)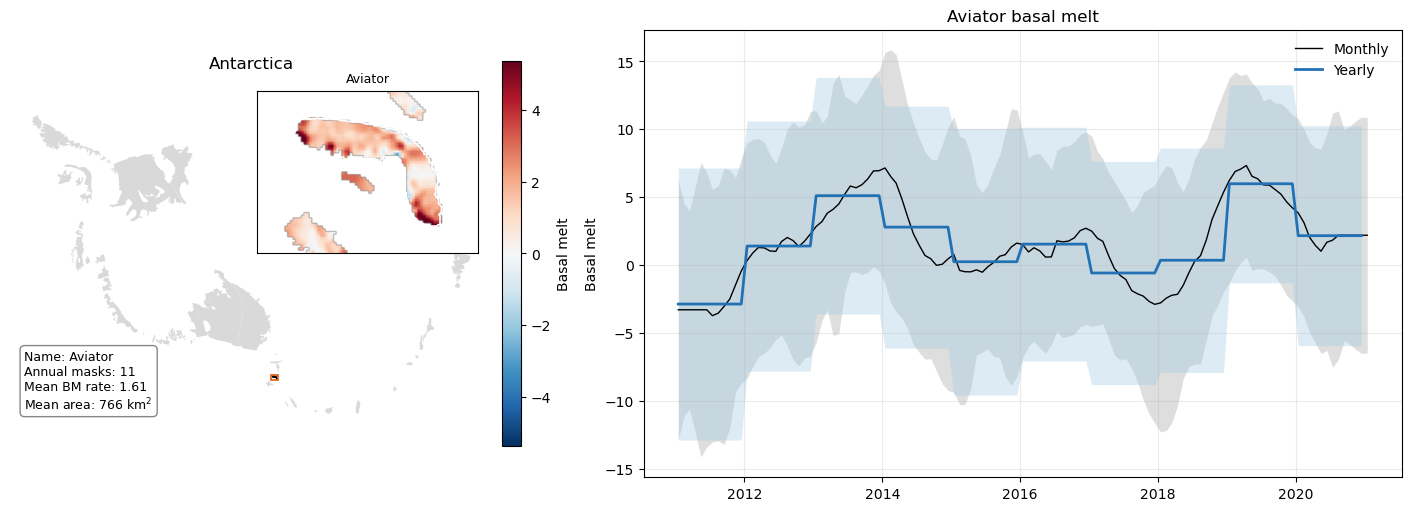
- Davison, B. J., Hogg, A. E., Gourmelen, N., Jakob, L., Wuite, J., Nagler, T., Greene, C. A., Andreasen, J., & Engdahl, M. E. (2023). Annual mass budget of Antarctic ice shelves from 1997 to 2021. Science Advances, 9(41). 10.1126/sciadv.adi0186
- Schmidt, G. A., Mankoff, K. D., Bamber, J. L., Burgard, C., Carroll, D., Chandler, D. M., Coulon, V., Davison, B. J., England, M. H., Holland, P. R., Jourdain, N. C., Li, Q., Marson, J. M., Mathiot, P., McMahon, C. R., Moon, T. A., Mottram, R., Nowicki, S., Olivé Abelló, A., … Ringeisen, D. (2025). Datasets and protocols for including anomalous freshwater from melting ice sheets in climate simulations. Geoscientific Model Development, 18(21), 8333–8361. 10.5194/gmd-18-8333-2025