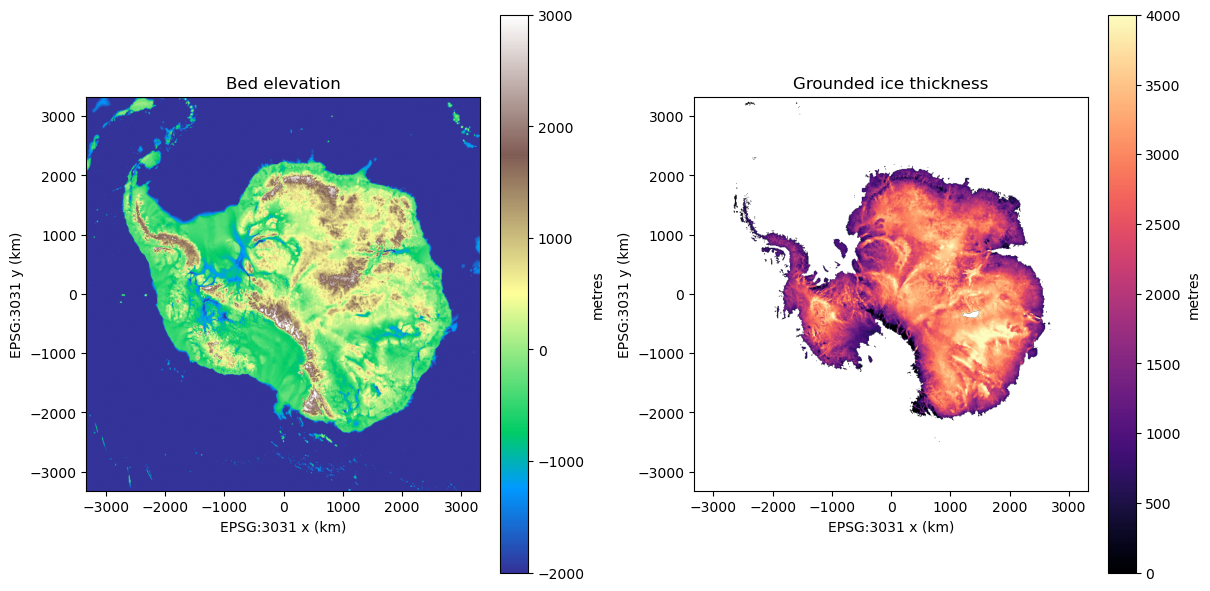
Description: Bed topography and bathymetry map of Antarctica with ice thickness, surface elevation, and mask layers.
Original data source: https://
opensciencedata .esa .int /products /bedrock -topography -antarctica -bedmachine /collection Reference: https://
nsidc .org /data /nsidc -0756 /versions/3 OSC entry: https://
opensciencedata .esa .int /products /bedrock -topography -antarctica -bedmachine /collection License: CC0-1.0
import matplotlib.pyplot as plt
import numpy as np
import xarray as xr

DATA_URL = "https://s3.waw4-1.cloudferro.com/EarthCODE/OSCAssets/polar_cube_datasets/bedrock_topography/NSIDC-0756_BedMachineAntarctica_19700101-20191001_V04.1.zarr/"
ds = xr.open_zarr(DATA_URL, chunks={})
dsLoading...
Sample the grid before plotting. This keeps the notebook responsive while preserving the continent-scale pattern.
coarsen_factor = 12
demo = ds[["bed", "thickness", "mask"]].coarsen(dim={"x": coarsen_factor, "y": coarsen_factor}, boundary="trim").max()
demo["grounded_thickness"] = demo["thickness"].where(demo["mask"] == 2)

demo
Loading...
Plot bed elevation and grounded ice thickness side by side.
x_km = demo["x"].values / 1000
y_km = demo["y"].values / 1000
extent = [
    float(np.nanmin(x_km)),
    float(np.nanmax(x_km)),
    float(np.nanmin(y_km)),
    float(np.nanmax(y_km)),
]
origin = "upper" if y_km[0] > y_km[-1] else "lower"

fig, axes = plt.subplots(1, 2, figsize=(12, 5.8), constrained_layout=True)

bed_image = axes[0].imshow(
    demo["bed"].values,
    extent=extent,
    origin=origin,
    cmap="terrain",
    vmin=-2000,
    vmax=3000,
)
axes[0].set_title("Bed elevation")
axes[0].set_xlabel("EPSG:3031 x (km)")
axes[0].set_ylabel("EPSG:3031 y (km)")
fig.colorbar(bed_image, ax=axes[0], label="metres")

thickness_image = axes[1].imshow(
    demo["grounded_thickness"].values,
    extent=extent,
    origin=origin,
    cmap="magma",
    vmin=0,
    vmax=4000,
)
axes[1].set_title("Grounded ice thickness")
axes[1].set_xlabel("EPSG:3031 x (km)")
axes[1].set_ylabel("EPSG:3031 y (km)")
fig.colorbar(thickness_image, ax=axes[1], label="metres")

for ax in axes:
    ax.set_aspect("equal")

plt.show()