Description: Time-evolving Antarctic calving fronts from observations.
Original Data Source: https://
zenodo .org /records /5903643 Reference: https://
www .nature .com /articles /s41586 -022 -05037-w OSC entry: https://
opensciencedata .esa .int /products /antarctic -ice -shelf -calving -fronts /collection License: CC-BY-4.0
Repo Folder: ./datasets/calving_fronts
import geopandas as gpd
import matplotlib.pyplot as plt
import pandas as pd

bucket = 's3://EarthCODE/'
endpoint_url = "https://s3.waw4-1.cloudferro.com"
region_name = "eu-west-2"
file = 'OSCAssets/polar_cube_datasets/calving_fronts/Antarctic_coastlines.parquet'
gdf = gpd.read_parquet(
f"{bucket}{file}",
storage_options={ "anon": True,
"client_kwargs": {
"endpoint_url": endpoint_url,
"region_name": region_name
}
}
)
gdf['area'] = gdf.arealargest_polygon = gdf.sort_values(['time', 'area'], ascending=False).groupby('time').first()
largest_polygonLoading...
fronts = largest_polygon.reset_index().sort_values("time")
fronts["year"] = pd.to_datetime(fronts["time"]).dt.year

changed = fronts.geometry.iloc[0].symmetric_difference(fronts.geometry.iloc[-1])
zoom = max(getattr(changed, "geoms", [changed]), key=lambda geom: geom.area)
xmin, ymin, xmax, ymax = zoom.bounds
pad = max(xmax - xmin, ymax - ymin) * 0.25

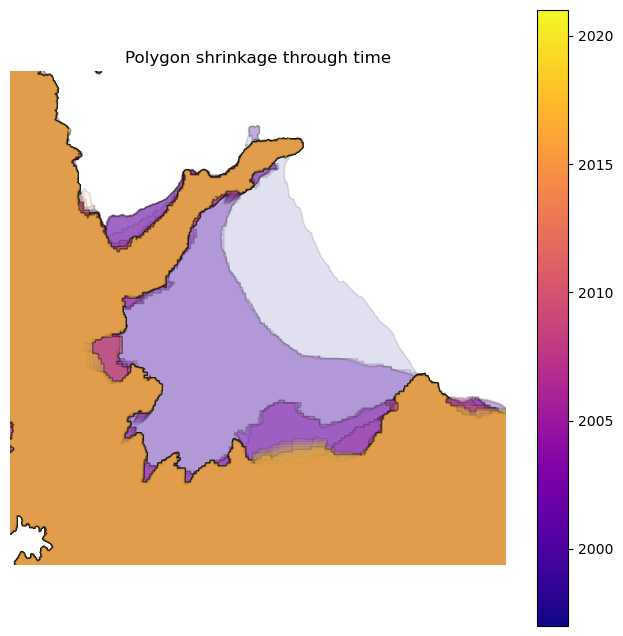
ax = fronts.plot(
    column="year",
    cmap="plasma",
    alpha=0.12,
    edgecolor="black",
    linewidth=1,
    legend=True,
    figsize=(8, 8),
)

ax.set_xlim(xmin - pad, xmax + pad)
ax.set_ylim(ymin - pad, ymax + pad)
ax.set(title="Polygon shrinkage through time", aspect="equal")
ax.set_axis_off()
plt.show()