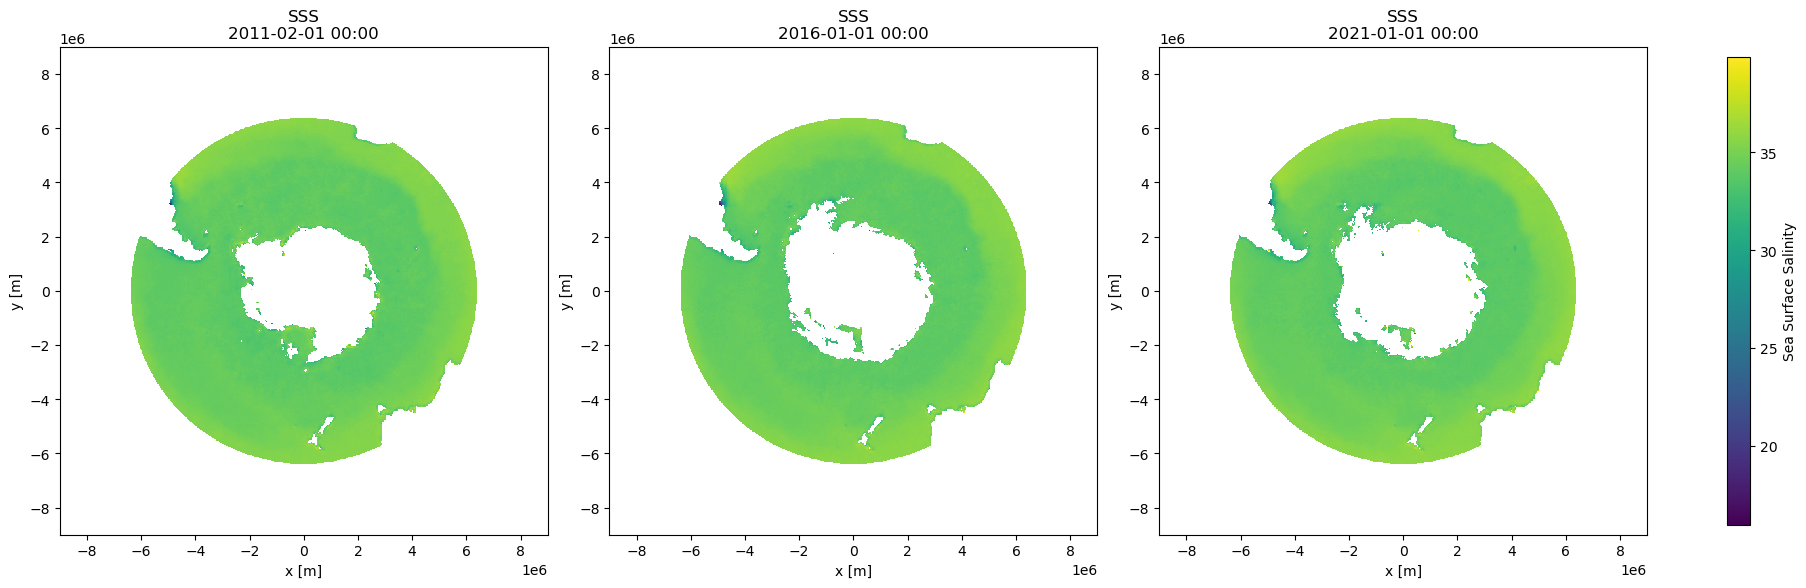
Description: Dedicated regional Sea Surface Salinity (SSS) product in the Southern Ocean. Level 3 9-day maps. Data acquisition: Satellite ESA SMOS mission (Soil Moisture and Ocean Salinity). Time coverage 01 February 2011 - 31 December 2022. Time resolution: 9-day. Maps frequency generation: Daily. Spatial coverage: Latitude range: 30ºS-90ºS Longitude range: 180ºW-180ºE. Spatial resolution: 25 km (EASE-SL grid). Sensor Satellite SMOS / MIRAS.
Original Data Source: https://
digital .csic .es /handle /10261 /332809 Reference: https://
essd .copernicus .org /articles /17 /5089 /2025/ OSC entry: https://
opensciencedata .esa .int /products /sofresh -sea -surface -salinity /collection License: CC-BY-4.0
Repo Folder: ./datasets/so-fresh
import xarray as xr
import matplotlib.pyplot as plt
url = 'https://s3.waw4-1.cloudferro.com/EarthCODE/OSCAssets/polar_cube_datasets/so-fresh/sofresh.zarr/'ds = xr.open_zarr(url)
dsLoading...
da = ds['sss']
subset = da.sel(
    time=["2011-02-01", "2016-01-01", "2021-01-01"],
    method="nearest"
)
vmin = subset.min(skipna=True).values
vmax = subset.max(skipna=True).values
fig, axes = plt.subplots(
nrows=1,
ncols=3,
figsize=(18, 6),
constrained_layout=True
)
for ax, t in zip(axes, subset.time):
plot_data = da.sel(time=t)
im = ax.pcolormesh(
ds["x"],
ds["y"],
plot_data,
shading="auto",
vmin=vmin,
vmax=vmax,
cmap="viridis"
)
ax.set_title(f"SSS\n{t.dt.strftime('%Y-%m-%d %H:%M').item()}")
ax.set_xlabel("x [m]")
ax.set_ylabel("y [m]")
ax.set_aspect("equal")
# shared colorbar
cbar = fig.colorbar(im, ax=axes, orientation="vertical", shrink=0.8)
cbar.set_label("Sea Surface Salinity")
plt.show()