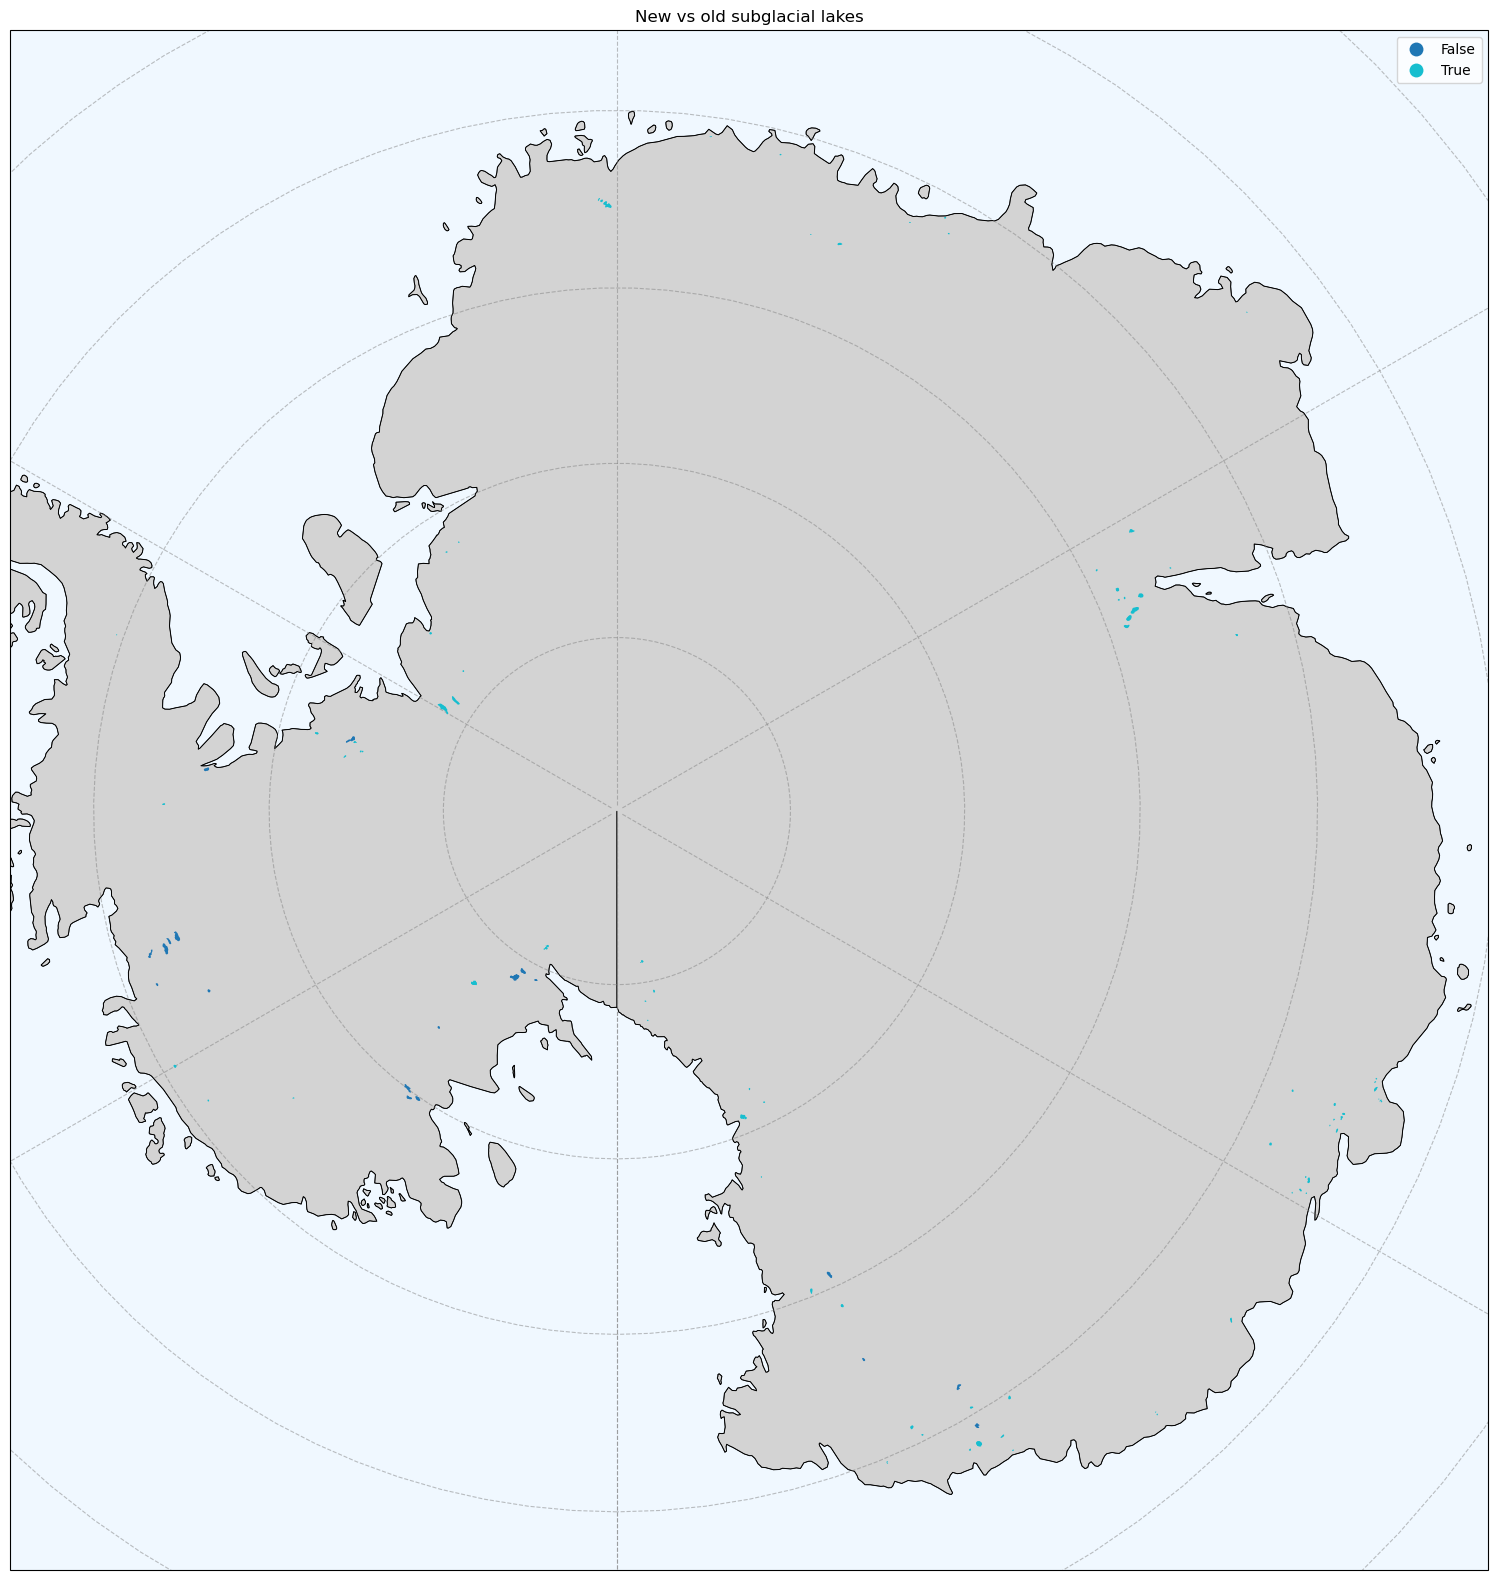
Description: 85 active Antarctic subglacial lakes detected from a decade of CryoSat-2 radar altimetry. Documenting draining and filling events and time-varying boundaries of subglacial lake activity. Ice surface elevation change (dz) for the period October 2010 to July 2020.
Original Data Source: https://
zenodo .org /records /16330565 Reference: https://
www .nature .com /articles /s41467 -025 -63773-9 OSC entry: https://
opensciencedata .esa .int /products /subglacial -lakes -boundries /collection License: CC-BY-4.0
Repo Folder: ./datasets/subglacial_lakes
import geopandas as gpd
import matplotlib.pyplot as plt
import cartopy.crs as ccrs
import cartopy.feature as cfeature
antarctic_crs = ccrs.SouthPolarStereo(
central_longitude=0,
true_scale_latitude=-71,
)# Read the subglacial lakes boundaries
bucket = 's3://EarthCODE/'
endpoint_url = "https://s3.waw4-1.cloudferro.com"
region_name = "eu-west-2"
file = 'OSCAssets/polar_cube_datasets/subglacial_lakes/subglacial_lakes_boundries.parquet'
gdf = gpd.read_parquet(
f"{bucket}{file}",
storage_options={ "anon": True,
"client_kwargs": {
"endpoint_url": endpoint_url,
"region_name": region_name
}
}
)
gdf['area'] = gdf.area
gdf/tmp/ipykernel_18956/3385685713.py:18: UserWarning: Geometry is in a geographic CRS. Results from 'area' are likely incorrect. Use 'GeoSeries.to_crs()' to re-project geometries to a projected CRS before this operation.
gdf['area'] = gdf.area
Loading...
gdf_3031 = gdf.to_crs(epsg=3031)

fig, ax = plt.subplots(
    figsize=(20, 20),
    subplot_kw={"projection": antarctic_crs},
)

ax.add_feature(cfeature.OCEAN, facecolor="aliceblue", zorder=0)
ax.add_feature(cfeature.LAND, facecolor="lightgray", edgecolor="black", linewidth=0.4, zorder=1)
ax.coastlines(resolution="50m", color="black", linewidth=0.7, zorder=2)
ax.gridlines(draw_labels=False, color="gray", alpha=0.5, linestyle="--")

gdf_3031.plot(column="new_sgl_glake", legend=True, ax=ax, zorder=3)

minx, miny, maxx, maxy = gdf_3031.total_bounds
pad = max(maxx - minx, maxy - miny) * 0.08
ax.set_extent([minx - pad, maxx + pad, miny - pad, maxy + pad], crs=antarctic_crs)

ax.set_title("New vs old subglacial lakes")
plt.show()