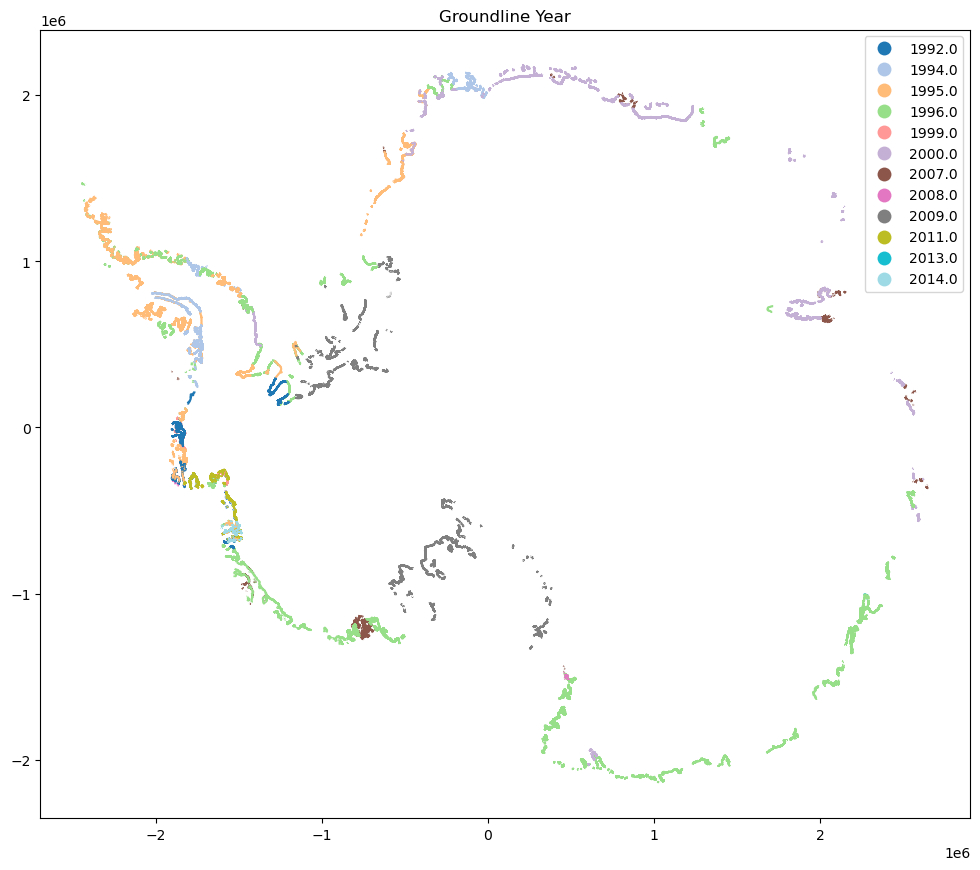
Description: This data set, part of the NASA Making Earth System Data Records for Use in Research Environments (MEaSUREs) program, provides 22 years of comprehensive high-resolution mapping of grounding lines in Antarctica from 1992 to 2014. The data were derived using differential satellite synthetic aperture radar interferometry (DInSAR) measurements from the following platforms: Earth Remote Sensing Satellites 1 and 2 (ERS-1 and ERS-2), RADARSAT-1, RADARSAT-2, the Advanced Land Observing System Phased Array type L-band Synthetic Aperture Radar (ALOS PALSAR), Cosmo Skymed, and Copernicus Sentinel-1.
Original Data Source: https://
cmr .earthdata .nasa .gov /virtual -directory /collections /C3291177478 -NSIDC _CPRD Reference: https://
nsidc .org /sites /default /files /nsidc -0498 -v002 -userguide _1 .pdf OSC entry: https://
opensciencedata .esa .int /products /grounding -line -position -antarctica /collection License: CC0-1.0
Repo Folder: ./datasets/groundlines
import geopandas as gpd
import matplotlib.pyplot as plt

bucket = 's3://EarthCODE/'
endpoint_url = "https://s3.waw4-1.cloudferro.com"
region_name = "eu-west-2"
file = 'OSCAssets/polar_cube_datasets/groundlines/InSAR_GL_Antarctica.parquet'
gdf = gpd.read_parquet(
f"{bucket}{file}",
storage_options={ "anon": True,
"client_kwargs": {
"endpoint_url": endpoint_url,
"region_name": region_name
}
}
)
gdf['SENSOR'].unique()array(['PALSAR', 'ERS', 'R2', 'RSAT', 'SENTINEL1A', 'CSK'], dtype=object)fig, ax = plt.subplots(figsize=(12,12))
gdf.to_crs('epsg:3031').plot(column='SENSOR', legend=True, ax=ax)
ax.set_title('Groundline Sensors')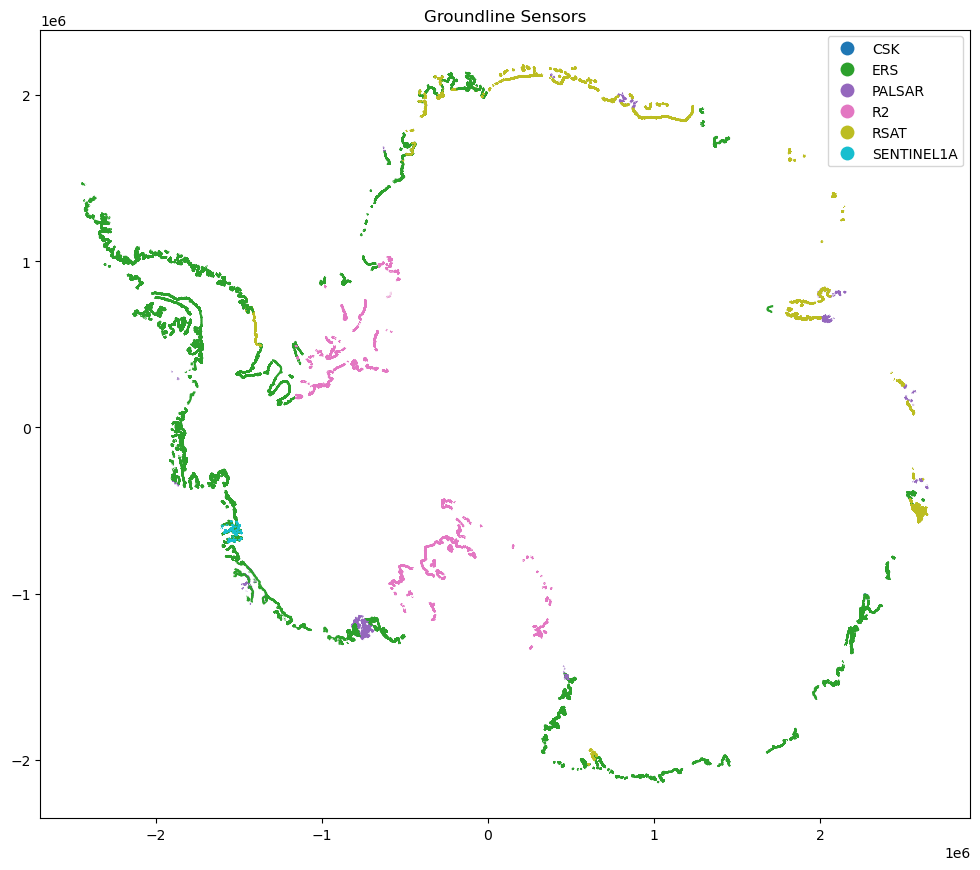
fig, ax = plt.subplots(figsize=(12,12))
gdf.to_crs('epsg:3031').plot(column=gdf['DATE1'].dt.year.round(),
                             legend=True, categorical=True, ax=ax, cmap='tab20')
ax.set_title('Groundline Year')