ALBATROS
Description: Decade-long most recently reprocessed CryoSat datasets, innovative information on bathymetry gradient location through the analysis of sea ice surface roughness characteristics, and the compilation of the best available datasets in ice-shelf regions.
Original Data Source: https://
albatross .noveltis .fr/ Reference: https://
albatross .noveltis .fr /publications/ OSC entry:
https://
opensciencedata .esa .int /products /tidal -elevation -amplitude -phase -tide -gauges /collection https://
opensciencedata .esa .int /products /tidal -elevation -cryosat2 -2019 /collection https://
opensciencedata .esa .int /products /tidal -elevation -GPS -FilchnerRonne -2009 /collection https://
opensciencedata .esa .int /products /tidal -elevation -tide -gauge -kerguelen /collection
License: CC-BY-NC-4.0
Repo Folder: ./datasets/albatross
import numpy as np
import pandas as pd
import geopandas as gpd
import matplotlib.pyplot as plt
import cartopy.crs as ccrs
import cartopy.feature as cfeature
bucket = 's3://EarthCODE/'
endpoint_url = "https://s3.waw4-1.cloudferro.com"
region_name = "eu-west-2"
file = 'OSCAssets/polar_cube_datasets/albatross/elevation_prediction_cryosat2_SAR_A.parquet'
gdf = gpd.read_parquet(
f"{bucket}{file}",
storage_options={ "anon": True,
"client_kwargs": {
"endpoint_url": endpoint_url,
"region_name": region_name
}
}
)time_col = "time"
value_col = "tidal_elevation_prediction_m"
source_crs = "EPSG:4326"
target_crs = "EPSG:6932"
grid_size_m = 25_000 # 25 km
target_date = "2019-04-03"# subset daily data
start = pd.Timestamp(target_date)
end = start + pd.Timedelta(days=7)
gdf_day = gdf.loc[
(gdf[time_col] >= start) &
(gdf[time_col] < end)
].copy()
gdf_day = gdf_day.dropna(subset=[value_col])# reproject and regrid
gdf_6932 = gdf_day.to_crs(target_crs)
from shapely.geometry import box
minx, miny, maxx, maxy = gdf_6932.total_bounds
# Snap grid bounds to the 25 km grid
minx = np.floor(minx / grid_size_m) * grid_size_m
miny = np.floor(miny / grid_size_m) * grid_size_m
maxx = np.ceil(maxx / grid_size_m) * grid_size_m
maxy = np.ceil(maxy / grid_size_m) * grid_size_m
x_edges = np.arange(minx, maxx + grid_size_m, grid_size_m)
y_edges = np.arange(miny, maxy + grid_size_m, grid_size_m)
grid_cells = []
for x0 in x_edges[:-1]:
for y0 in y_edges[:-1]:
x1 = x0 + grid_size_m
y1 = y0 + grid_size_m
grid_cells.append(
{
"geometry": box(x0, y0, x1, y1),
"grid_x": x0,
"grid_y": y0
}
)
grid = gpd.GeoDataFrame(grid_cells, crs=target_crs)
print(len(grid))
grid.head()54285
# assign pints to grid cells
points_in_grid = gpd.sjoin(
    gdf_6932,
    grid[["grid_x", "grid_y", "geometry"]],
    how="inner",
    predicate="within"
)

points_in_grid.head()grid_avg = (
points_in_grid
.groupby(["grid_x", "grid_y"], as_index=False)
.agg(
avg_tidal_elevation_m=(value_col, "mean"),
n_observations=(value_col, "count"),
first_time=(time_col, "min"),
last_time=(time_col, "max")
)
)
grid_avg.head()grid_result = grid.merge(
grid_avg,
on=["grid_x", "grid_y"],
how="left"
)
grid_result_nonnull = grid_result.dropna(subset=["avg_tidal_elevation_m"]).copy()
grid_result_nonnull.head()antarctic_crs = ccrs.SouthPolarStereo(
central_longitude=0,
true_scale_latitude=-71,
)fig, ax = plt.subplots(
figsize=(10, 10),
subplot_kw={"projection": antarctic_crs},
)
ax.add_feature(cfeature.OCEAN, facecolor="aliceblue", zorder=0)
ax.add_feature(cfeature.LAND, facecolor="lightgray", edgecolor="black", linewidth=0.4, zorder=1)
ax.coastlines(resolution="50m", color="black", linewidth=0.7, zorder=2)
ax.gridlines(draw_labels=False, color="gray", alpha=0.5, linestyle="--")
grid_result_nonnull.plot(
column="avg_tidal_elevation_m",
ax=ax,
legend=True,
edgecolor="black",
linewidth=0.2,
zorder=3,
)
minx, miny, maxx, maxy = grid_result_nonnull.total_bounds
pad = max(maxx - minx, maxy - miny) * 0.08
ax.set_extent([minx - pad, maxx + pad, miny - pad, maxy + pad], crs=antarctic_crs)
ax.set_title(f"Average tidal elevation prediction, 12.5 km grid, {start.date()} - {end.date()}")
ax.set_aspect("equal")
plt.show()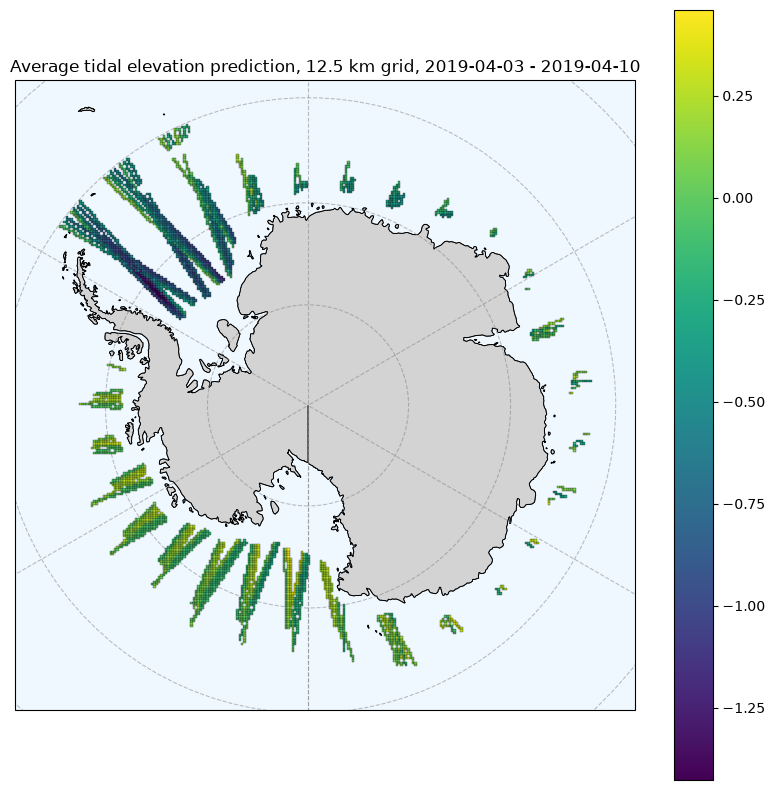
grid_result_nonnull.to_parquet("../../downloaded_data/albatros_example.parquet")