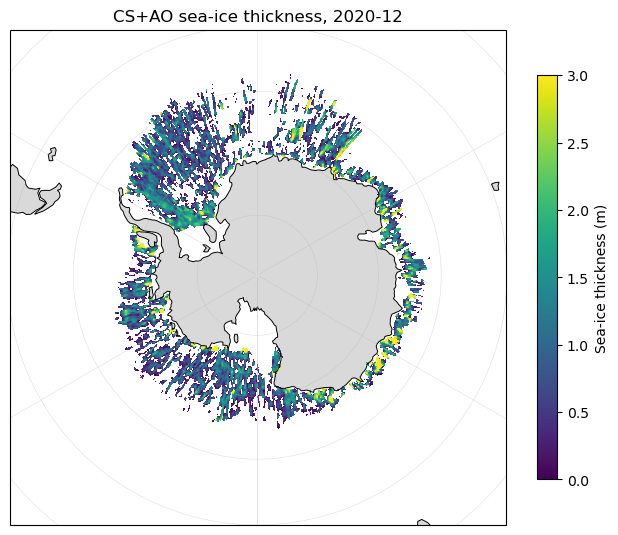
Description: Sea ice thickness derived from CryoSat-2 radar freeboard combined with the Altimetric Snow Depth snow solution.
Original data source: http://
cryosat .mssl .ucl .ac .uk /csao /public -docs .html OSC entry: https://
opensciencedata .esa .int /products /southern -ocean -sit -from -cryosat -2 /collection License: CC-BY-NC-4.0
import matplotlib.pyplot as plt
import xarray as xr
import cartopy.crs as ccrs
import cartopy.feature as cfeature

DATA_URL = "https://s3.waw4-1.cloudferro.com/EarthCODE/OSCAssets/polar_cube_datasets/cs+ao/cs_plus.zarr"
THICKNESS = "SIT_ASD_mean"
CONCENTRATION = "sea_ice_conc"
MIN_CONCENTRATION = 15
Open only the metadata first. The data remains lazy until a later cell asks for a plot or a number.
ds = xr.open_zarr(DATA_URL, consolidated=True, chunks={})
ds[[THICKNESS, CONCENTRATION]]
Loading...
Select the latest available month and keep only plausible sea-ice thickness where concentration is at least 15 percent.
month = ds["time"].isel(time=-1)
month_label = str(month.values)[:7]

thickness = ds[THICKNESS].sel(time=month)
concentration = ds[CONCENTRATION].sel(time=month)

thickness = thickness.where(concentration >= MIN_CONCENTRATION)
thickness = thickness.where((thickness >= 0) & (thickness <= 20))
thickness.name = "sea_ice_thickness_m"

thickness
Loading...
mean_thickness = thickness.mean(skipna=True).compute()

print(f"Demo month: {month_label}")
print(f"Mean sea-ice thickness where concentration >= {MIN_CONCENTRATION}%: {float(mean_thickness):.2f} m")
Demo month: 2020-12
Mean sea-ice thickness where concentration >= 15%: 1.07 m
Plot the same month on a simple south polar map.
plot_data = thickness.compute()

fig = plt.figure(figsize=(8, 7))
ax = plt.axes(projection=ccrs.SouthPolarStereo())

mesh = ax.pcolormesh(
    ds["lon"],
    ds["lat"],
    plot_data,
    transform=ccrs.PlateCarree(),
    shading="auto",
    cmap="viridis",
    vmin=0,
    vmax=3,
)
fig.colorbar(mesh, ax=ax, shrink=0.75, pad=0.05, label="Sea-ice thickness (m)")

ax.set_extent([-180, 180, -90, -50], crs=ccrs.PlateCarree())
ax.add_feature(cfeature.LAND, facecolor="0.85", zorder=0)
ax.coastlines(linewidth=0.7)
ax.gridlines(draw_labels=False, linewidth=0.4, alpha=0.4)
ax.set_title(f"CS+AO sea-ice thickness, {month_label}")

plt.show()