* Original Data Source: https://4dmed.artov.ismar.cnr.it/thredds/catalog/4dmed/catalog_NN.html
* Reference:  https://doi.org/10.25423/cmcc/4dmedsea_biophys_rep_3d
* OSC entry: https://opensciencedata.esa.int/products/4dmed-t-s-geo-a-150/collection
* License: CC-BY-4.0
import xarray as xr
zarr_href = 'https://s3.waw4-1.cloudferro.com/EarthCODE/OSCAssets/4dmed/4dmed-bp.zarr/'ds = xr.open_zarr(zarr_href)
dsLoading...
import numpy as np

day_index = 15

surface_temp = (
    ds['TEMP3D']
    .isel(time=day_index)
    .sel(depth=1, method="nearest")
    .compute()
)

surface_temp
Loading...
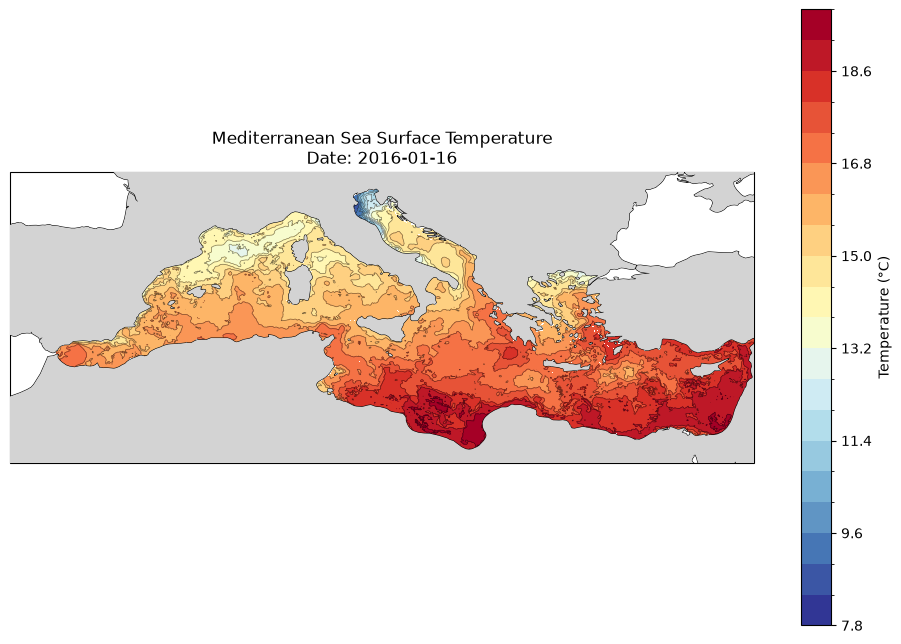
import matplotlib.pyplot as plt
import cartopy.crs as ccrs
import cartopy.feature as cfeature

# Set up the figure and the map projection
fig, ax = plt.subplots(figsize=(12, 8), subplot_kw={'projection': ccrs.PlateCarree()})

# Add geographic features for context
ax.add_feature(cfeature.COASTLINE, linewidth=0.8)
ax.add_feature(cfeature.LAND, facecolor='lightgray', zorder=100) # Put land on top of ocean
ax.add_feature(cfeature.BORDERS, linestyle=':', linewidth=0.5)

# 3. Plot filled contours (the colors)
filled_c = surface_temp.plot.contourf(
    ax=ax,
    x='lon',
    y='lat',
    transform=ccrs.PlateCarree(),
    levels=20,               # Number of color gradients
    cmap='RdYlBu_r',         # Red-Yellow-Blue colormap (reversed so red=warm)
    cbar_kwargs={'label': 'Temperature (°C)'}
)

# plot contour lines on top
lines_c = surface_temp.plot.contour(
    ax=ax,
    x='lon',
    y='lat',
    transform=ccrs.PlateCarree(),
    levels=20,               # Keep levels identical to contourf to match boundaries
    colors='black',          # Black lines
    linewidths=0.5,
    alpha=0.5                # Slightly transparent
)

# Add a title dynamically using xarray attributes if they exist
time_str = str(surface_temp.time.values)[:10] # Gets 'YYYY-MM-DD'
ax.set_title(f"Mediterranean Sea Surface Temperature\nDate: {time_str}")

plt.show()