* Original Data Source: https://doi.org/10.25921/m5wx-ja34
* Reference:  https://doi.org/10.25921/m5wx-ja34
* OSC entry: https://opensciencedata.esa.int/products/ocean-soda-ethz/collection
* License: CC-BY-NC-SA-4.0Global
import xarray as xrdata_href = 'https://s3.waw4-1.cloudferro.com/EarthCODE/OSCAssets/ocean-soda/ocean-soda.zarr'ds = xr.open_zarr(data_href, chunks={})
dsLoading...
ds.salinity.isel(time=0).plot()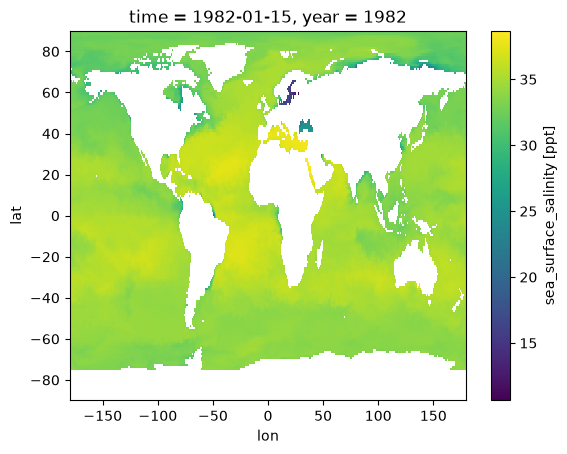
8 Day metrics
zarr_href1 = 'https://s3.waw4-1.cloudferro.com/EarthCODE/OSCAssets/ocean-soda/dfco2.zarr'
zarr_href2 = 'https://s3.waw4-1.cloudferro.com/EarthCODE/OSCAssets/ocean-soda/fgco2.zarr'
zarr_href3 = 'https://s3.waw4-1.cloudferro.com/EarthCODE/OSCAssets/ocean-soda/fgco2CT.zarr'
zarr_href4 = 'https://s3.waw4-1.cloudferro.com/EarthCODE/OSCAssets/ocean-soda/ice.zarr'
zarr_href5 = 'https://s3.waw4-1.cloudferro.com/EarthCODE/OSCAssets/ocean-soda/kw.zarr'
zarr_href6 = 'https://s3.waw4-1.cloudferro.com/EarthCODE/OSCAssets/ocean-soda/sfco2.zarr'
zarr_href7 = 'https://s3.waw4-1.cloudferro.com/EarthCODE/OSCAssets/ocean-soda/sfco2_uncert.zarr'
zarr_href8 = 'https://s3.waw4-1.cloudferro.com/EarthCODE/OSCAssets/ocean-soda/sol.zarr'
zarr_href9 = 'https://s3.waw4-1.cloudferro.com/EarthCODE/OSCAssets/ocean-soda/temperature.zarr'
ds = xr.open_zarr(zarr_href1)
dsLoading...
import matplotlib.pyplot as plt
import cartopy.crs as ccrs
import cartopy.feature as cfeature
import numpy as np

# Choose date
date = "2020-06"

# Select FSLE for that date
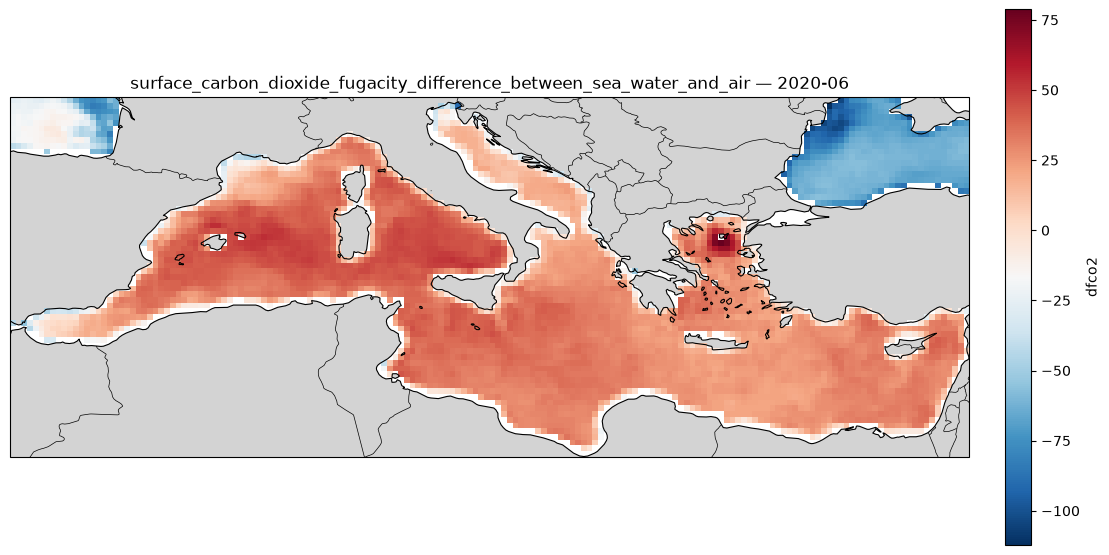
pp = ds["dfco2"].sel( lon=slice(-6.062, 36.06), lat=slice(30.27, 45.98), drop=True)
pp = pp.sel(time=np.datetime64(date), drop=True, method='nearest')

# 2-D coordinates
lon = pp["lon"]
lat = pp["lat"]

# Create map
fig = plt.figure(figsize=(12, 7))

ax = plt.axes(projection=ccrs.PlateCarree())

# Plot FSLE
pcm = ax.pcolormesh(
    lon,
    lat,
    pp,
    transform=ccrs.PlateCarree(),
    shading="auto",
    cmap="RdBu_r"
)

# Basemap features
ax.add_feature(cfeature.LAND, facecolor="lightgray")
ax.add_feature(cfeature.COASTLINE, linewidth=0.8)
ax.add_feature(cfeature.BORDERS, linewidth=0.5)


# Colourbar
cbar = plt.colorbar(
    pcm,
    ax=ax,
    orientation="vertical",
    pad=0.03,
    shrink=0.8
)
cbar.set_label("dfco2")

ax.set_title(f"surface_carbon_dioxide_fugacity_difference_between_sea_water_and_air - {date}")

plt.tight_layout()
plt.show()