* Original Data Source:
    https://zenodo.org/records/8154587 - not processed
    https://data-cersat.ifremer.fr/data/marine-heat-wave/esa-careheat/cnr/v2/
    https://sextant.ifremer.fr/record/87a33c31-5930-4379-8cfa-0b29ceee9756/
* Reference:  https://opensciencedata.esa.int/projects/careheat/collection
* OSC entry: https://opensciencedata.esa.int/projects/careheat/collection
* License: cc-by-4.0.
import xarray as xrds = xr.open_zarr('https://s3.waw4-1.cloudferro.com/EarthCODE/OSCAssets/ocean_datasets/careheat_mhw_2d.zarr/')
dsLoading...
import matplotlib.pyplot as plt
import cartopy.crs as ccrs
import cartopy.feature as cfeature
from matplotlib.colors import BoundaryNorm
import numpy as np

date = "2020-06"


da = ds["category"].sel(time=np.datetime64(date), lon=slice(-6.062, 36.06), lat=slice(30.27, 45.98), drop=True)

# Categories present in the data
categories = [0, 1, 2, 3, 4]

# Discrete colormap
cmap = plt.get_cmap("viridis", len(categories))

# Put colour boundaries halfway between categories
bounds = [-0.5, 0.5, 1.5, 2.5, 3.5, 4.5]
norm = BoundaryNorm(bounds, cmap.N)

fig, ax = plt.subplots(
    figsize=(12, 6),
    subplot_kw={"projection": ccrs.PlateCarree()}
)

im = ax.pcolormesh(
    da.lon,
    da.lat,
    da,
    transform=ccrs.PlateCarree(),
    cmap=cmap,
    norm=norm,
    shading="auto"
)

ax.coastlines()
ax.add_feature(cfeature.LAND, facecolor="lightgray")


labels = [
    "No event",
    "Moderate",
    "Strong",
    "Severe",
    "Extreme"
]

cbar = fig.colorbar(
    im,
    ax=ax,
    ticks=[0, 1, 2, 3, 4],
    pad=0.03
)

cbar.ax.set_yticklabels(labels)
cbar.set_label("Marine Heatwaves category")

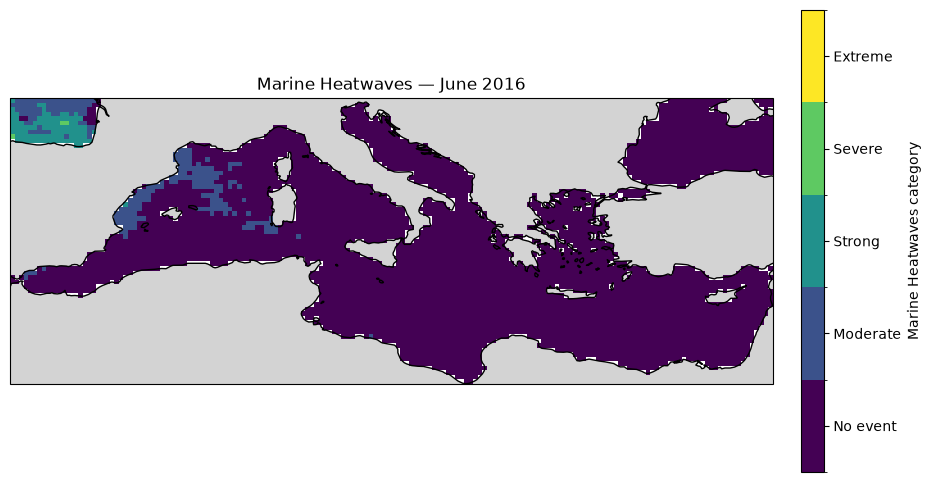
ax.set_title("Marine Heatwaves - June 2016")

plt.show()