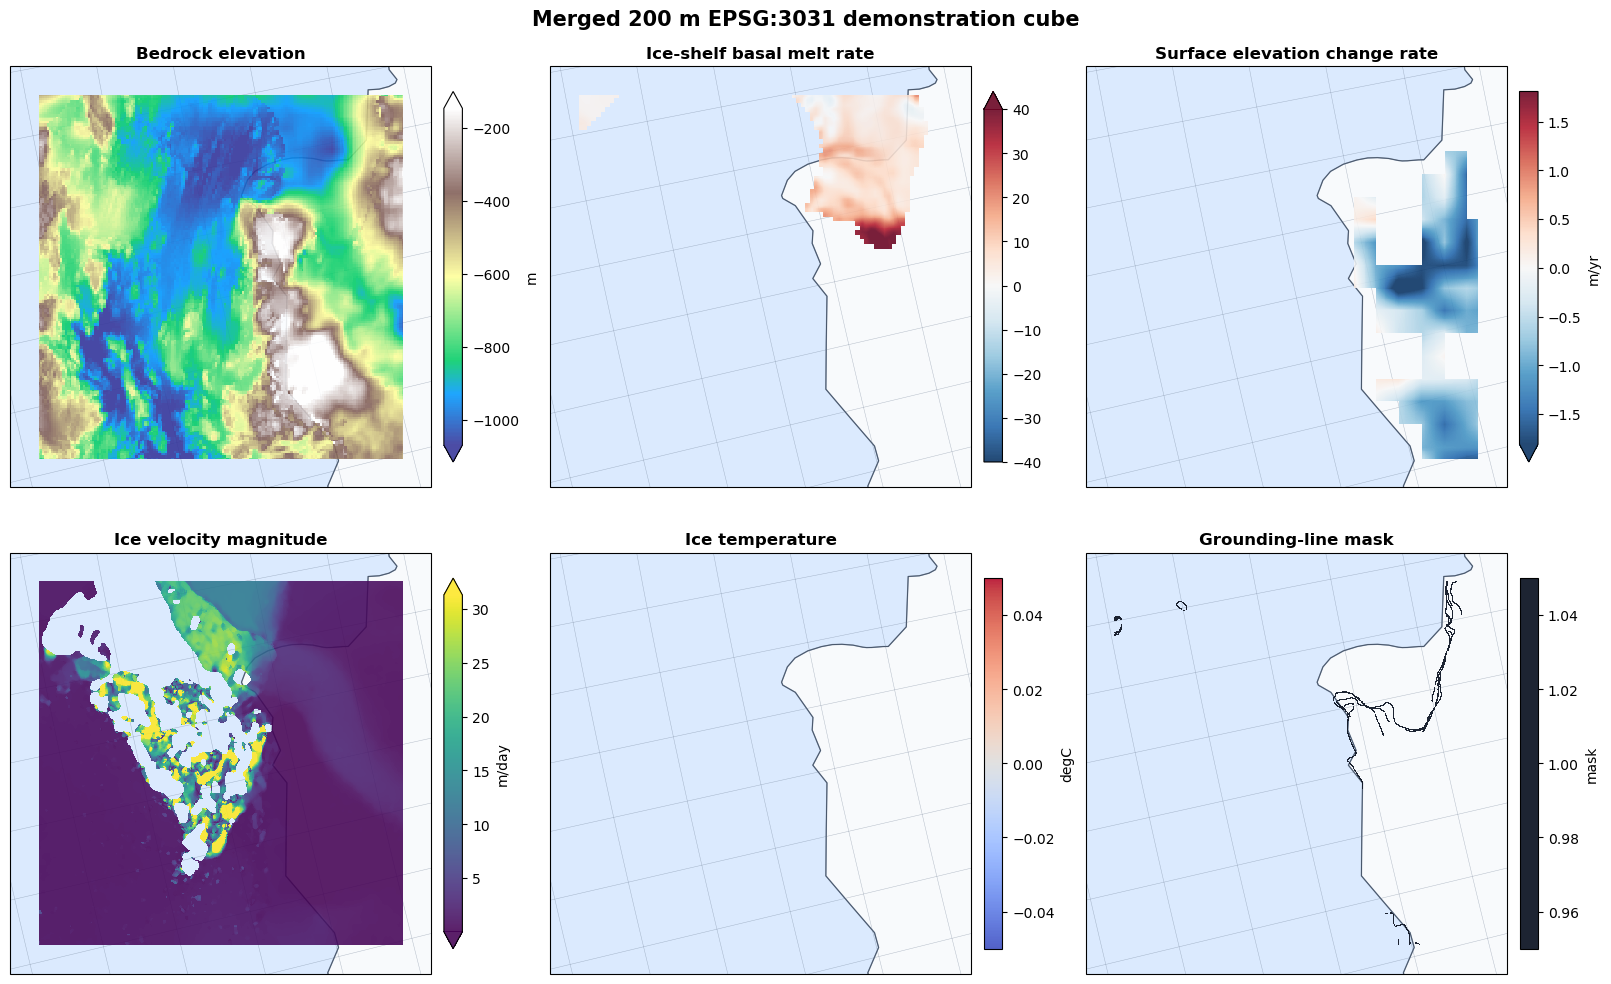
This notebook shows how to combine several datasets into a single cube in a simple way, based on nearest neighbours interpolation . It is similar to how the large 100m Antarctica cubes were built:
Creating a regular target grid
Transforming all the data to zarr raster datsets
Interpolation to the target grid the using nearest neighbour method
The example uses an 80 km by 80 km Amundsen Sea region at 200 m spacing, for a specific date, which is small enough to run quickly. If you want to run it one a larger area, or time horizon youll have to update the code.
from pathlib import Path

import geopandas as gpd
import numpy as np
import pandas as pd
import rasterio
import xarray as xr
from dask.diagnostics import ProgressBar
from pyproj import CRS, Transformer
from rasterio import features
from rasterio.enums import Resampling
from rasterio.transform import from_origin
from rasterio.warp import reproject, transform_bounds
from scipy.spatial import cKDTree
from shapely.geometry import box

pd.set_option("display.max_colwidth", 120)

TARGET_CRS = "EPSG:3031"
AOI_CENTER_XY_M = (-1_600_000.0, -350_000.0)
AOI_WIDTH_M = 80_000
TARGET_RESOLUTION_M = 200
VELOCITY_TIME_TARGET = "2019-01-01"
ICE_TEMPERATURE_DEPTH_M = 1_000

OUTPUT_DIR = Path("../downloaded_data/")
FINAL_CUBE = OUTPUT_DIR / "amundsen_200m_demo_cube.zarr"

S3_OPTIONS = {
    "anon": True,
    "client_kwargs": {
        "endpoint_url": "https://s3.waw4-1.cloudferro.com",
        "region_name": "eu-west-2",
    },
}
SOURCES = {
    "bedmachine_zarr": "https://s3.waw4-1.cloudferro.com/EarthCODE/OSCAssets/polar_cube_datasets/bedrock_topography/NSIDC-0756_BedMachineAntarctica_19700101-20191001_V04.1.zarr/",
    "sec_zarr": "https://s3.waw4-1.cloudferro.com/EarthCODE/OSCAssets/polar_cube_datasets/surface_elevation/ESACCI-AIS-L3C-SEC-MULTIMISSION-5KM-5YEAR-MEANS-1991-2021-fv1.zarr/",
    "ice_velocity_zarr": "https://s3.waw4-1.cloudferro.com/EarthCODE/OSCAssets/polar_cube_datasets/ice_velocity/ice_velocity.zarr/",
    "ice_temperature_zarr": "https://s3.waw4-1.cloudferro.com/EarthCODE/OSCAssets/polar_cube_datasets/ice_sheet_temperature/SM_TEST_MIR_ITUDP4_20130101T000000_20141231T000000_200_001_0.zarr/",
    "basal_melt_cog": "https://s3.waw4-1.cloudferro.com/EarthCODE/OSCAssets/polar_cube_datasets/basal_melt/basal_melt_map_racmo_firn_air_corrected.tif",
    "groundlines_parquet": "s3://EarthCODE/OSCAssets/polar_cube_datasets/groundlines/InSAR_GL_Antarctica.parquet",
    "supraglacial_lakes_parquet": "s3://EarthCODE/OSCAssets/polar_cube_datasets/supraglacial_lakes/WAIS_Jan_2017_Polygons.parquet",
    "subglacial_lakes_parquet": "s3://EarthCODE/OSCAssets/polar_cube_datasets/subglacial_lakes/subglacial_lakes_boundries.parquet",
    "calving_fronts_parquet": "s3://EarthCODE/OSCAssets/polar_cube_datasets/calving_fronts/Antarctic_coastlines.parquet",
}

pd.DataFrame.from_dict(SOURCES, orient="index", columns=["source"])
1. Build the target grid template
half_width = AOI_WIDTH_M / 2
left = AOI_CENTER_XY_M[0] - half_width
right = AOI_CENTER_XY_M[0] + half_width
bottom = AOI_CENTER_XY_M[1] - half_width
top = AOI_CENTER_XY_M[1] + half_width

nx = int(AOI_WIDTH_M / TARGET_RESOLUTION_M)
ny = int(AOI_WIDTH_M / TARGET_RESOLUTION_M)

TARGET_X = left + TARGET_RESOLUTION_M / 2 + np.arange(nx) * TARGET_RESOLUTION_M
TARGET_Y = top - TARGET_RESOLUTION_M / 2 - np.arange(ny) * TARGET_RESOLUTION_M
TARGET_TRANSFORM = from_origin(left, top, TARGET_RESOLUTION_M, TARGET_RESOLUTION_M)
TARGET_SHAPE = (TARGET_Y.size, TARGET_X.size)
TARGET_BOUNDS = (left, bottom, right, top)

TARGET_COORDS = {
    "y": ("y", TARGET_Y, {"standard_name": "projection_y_coordinate", "units": "m"}),
    "x": ("x", TARGET_X, {"standard_name": "projection_x_coordinate", "units": "m"}),
}

crs_wkt = CRS.from_user_input(TARGET_CRS).to_wkt()
TARGET_TEMPLATE = xr.Dataset(
    coords=TARGET_COORDS,
    data_vars={"spatial_ref": xr.DataArray(0, attrs={"crs_wkt": crs_wkt, "spatial_ref": crs_wkt})},
    attrs={"crs": TARGET_CRS, "resolution_m": TARGET_RESOLUTION_M},
)

TARGET_TEMPLATE
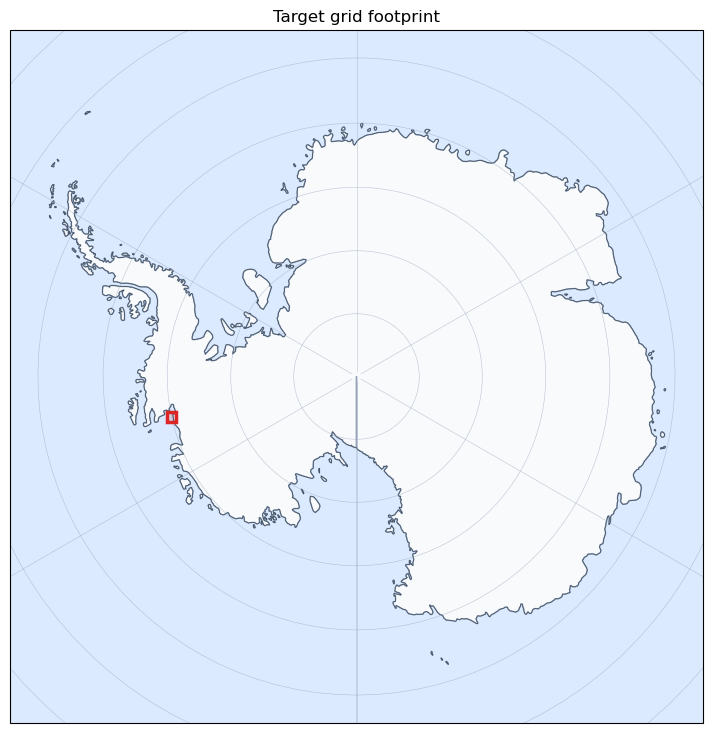
Check the grid location
The red square is the grid region every source will be clipped or interpolated to.
import cartopy.crs as ccrs
import cartopy.feature as cfeature
import matplotlib.pyplot as plt
from matplotlib.patches import Rectangle

antarctic_crs = ccrs.SouthPolarStereo(central_longitude=0, true_scale_latitude=-71)

fig = plt.figure(figsize=(9, 9))
ax = plt.axes(projection=antarctic_crs)
ax.set_xlim(-3_000_000, 3_000_000)
ax.set_ylim(-3_000_000, 3_000_000)
ax.add_feature(cfeature.OCEAN, facecolor="#dbeafe", zorder=0)
ax.add_feature(cfeature.LAND, facecolor="#f8fafc", edgecolor="#94a3b8", zorder=1)
ax.add_feature(cfeature.COASTLINE, linewidth=0.6, color="#475569", zorder=2)
ax.gridlines(draw_labels=False, linewidth=0.4, color="#94a3b8", alpha=0.6)

ax.add_patch(
    Rectangle(
        (left, bottom),
        right - left,
        top - bottom,
        facecolor="#dc262620",
        edgecolor="#dc2626",
        linewidth=2.5,
        transform=antarctic_crs,
        zorder=5,
    )
)
ax.set_title("Target grid footprint")
plt.show()
/home/krasen/micromamba/envs/pangeo/lib/python3.13/site-packages/cartopy/mpl/feature_artist.py:144: UserWarning: facecolor will have no effect as it has been defined as "never".
  warnings.warn('facecolor will have no effect as it has been '
2. Interpolation and transormation
def open_remote_zarr(url):
    """Open a remote Zarr store lazily with xarray."""
    return xr.open_zarr(url, chunks={}, consolidated=None)


def interpolate_to_grid(obj, method="nearest"):
    """Interpolate an xarray object with x/y coordinates onto the target grid."""
    source = obj.sortby("x").sortby("y")
    out = source.interp(x=TARGET_TEMPLATE["x"], y=TARGET_TEMPLATE["y"], method=method)
    out = out.assign_coords(x=TARGET_TEMPLATE["x"], y=TARGET_TEMPLATE["y"])
    out.attrs.update(obj.attrs)
    out.attrs["interpolation_method"] = method
    return out


def curvilinear_nearest_to_grid(values, longitude, latitude, name):
    """Project curvilinear lon/lat cells and copy each target cell's nearest value."""
    lon = ((np.asarray(longitude) + 180) % 360) - 180
    lat = np.asarray(latitude)
    source_x, source_y = Transformer.from_crs("EPSG:4326", TARGET_CRS, always_xy=True).transform(lon, lat)

    valid = np.isfinite(source_x) & np.isfinite(source_y) & np.isfinite(lon) & np.isfinite(lat)
    source_points = np.column_stack([source_x[valid], source_y[valid]])

    target_xx, target_yy = np.meshgrid(TARGET_X, TARGET_Y)
    target_points = np.column_stack([target_xx.ravel(), target_yy.ravel()])
    nearest = cKDTree(source_points).query(target_points, k=1)[1]

    data = np.asarray(values)[valid][nearest].reshape(TARGET_SHAPE).astype("float32")
    da = xr.DataArray(data, dims=("y", "x"), coords=TARGET_COORDS, name=name)
    da.attrs.update({"grid_mapping": "spatial_ref", "interpolation_method": "nearest"})
    return da


def clip_to_aoi(gdf):
    """Clip a GeoDataFrame to the target grid footprint."""
    if gdf.crs is None:
        gdf = gdf.set_crs(TARGET_CRS)
    gdf = gdf.to_crs(TARGET_CRS)
    gdf = gdf[gdf.geometry.notna() & ~gdf.geometry.is_empty]

    aoi = box(*TARGET_BOUNDS)
    clipped = gdf.loc[gdf.intersects(aoi)].copy()
    clipped[clipped.geometry.name] = clipped.geometry.intersection(aoi)
    return clipped[~clipped.geometry.is_empty].reset_index(drop=True)


def rasterize_mask(gdf, name, dtype="uint8"):
    """Rasterize AOI features into a binary mask on the target grid."""
    shapes = [(geom, 1) for geom in gdf.geometry if geom is not None and not geom.is_empty]
    data = np.zeros(TARGET_SHAPE, dtype=dtype)
    if shapes:
        data = features.rasterize(
            shapes,
            out_shape=TARGET_SHAPE,
            transform=TARGET_TRANSFORM,
            fill=0,
            dtype=dtype,
            all_touched=True,
        )

    return xr.DataArray(
        data,
        dims=("y", "x"),
        coords=TARGET_COORDS,
        name=name,
        attrs={"grid_mapping": "spatial_ref", "source_type": "geoparquet", "rasterized": "true"},
    )


def cog_to_grid(path, name, method="nearest"):
    """Read the COG window that overlaps the AOI and reproject it to the target grid."""
    with rasterio.open(path) as src:
        src_bounds = transform_bounds(TARGET_CRS, src.crs, *TARGET_BOUNDS, densify_pts=21)
        window = rasterio.windows.from_bounds(*src_bounds, transform=src.transform).round_offsets().round_lengths()
        source = src.read(1, window=window, boundless=True, masked=True).filled(np.nan).astype("float32")

        data = np.full(TARGET_SHAPE, np.nan, dtype="float32")
        reproject(
            source=source,
            destination=data,
            src_transform=src.window_transform(window),
            src_crs=src.crs,
            src_nodata=np.nan,
            dst_transform=TARGET_TRANSFORM,
            dst_crs=TARGET_CRS,
            dst_nodata=np.nan,
            resampling=Resampling[method],
        )

    da = xr.DataArray(data, dims=("y", "x"), coords=TARGET_COORDS, name=name)
    da.attrs.update({"grid_mapping": "spatial_ref", "source_type": "cog", "interpolation_method": method})
    return da
BedMachine layer
BedMachine is already on a projected x, y grid. Clip a slightly larger window, interpolate to the demo grid, and rename the variables for the final cube.
bedmachine = open_remote_zarr(SOURCES["bedmachine_zarr"]).set_index({"x": "x", "y": "y"})

bedmachine_roi = (
    bedmachine[["bed", "thickness", "mask"]]
    .sortby("x")
    .sortby("y")
    .sel(x=slice(left - 2_000, right + 2_000), y=slice(bottom - 2_000, top + 2_000))
)

bed_layer = interpolate_to_grid(bedmachine_roi, method="nearest")
bed_layer = bed_layer.rename(
    {
        "bed": "bedrock_elevation",
        "thickness": "ice_thickness",
        "mask": "bedmachine_mask",
    }
)

bed_layer["bedmachine_mask"] = bed_layer["bedmachine_mask"].round().fillna(0).astype("uint8")
bed_layer["bedrock_elevation"] = bed_layer["bedrock_elevation"].astype("float32")
bed_layer["ice_thickness"] = bed_layer["ice_thickness"].astype("float32")
bed_layer.attrs.update(source_type="zarr", interpolation_method="nearest")

bed_layer
Basal melt COG layer
The basal-melt map is a raster file, so read the overlapping window and reproject it directly onto the target grid.
basal_melt = cog_to_grid(
    SOURCES["basal_melt_cog"],
    name="ice_shelf_basal_melt_rate",
    method="bilinear",
)

basal_melt
Vector mask layers
GeoParquet vector datasets become binary masks. Each feature is clipped to the AOI, rasterised onto the target grid, and stored as an xarray layer.
vector_sources = {
    "groundlines_parquet": "grounding_line_mask",
    "supraglacial_lakes_parquet": "supraglacial_lake_mask",
    "subglacial_lakes_parquet": "subglacial_lake_mask",
}

vector_layers = []
feature_counts = {}

for source_key, layer_name in vector_sources.items():
    gdf = gpd.read_parquet(SOURCES[source_key], storage_options=S3_OPTIONS)
    clipped = clip_to_aoi(gdf)
    layer = rasterize_mask(clipped, layer_name)
    vector_layers.append(layer)
    feature_counts[layer_name] = len(clipped)

pd.Series(feature_counts, name="features_in_aoi")
grounding_line_mask       9
supraglacial_lake_mask    0
subglacial_lake_mask      0
Name: features_in_aoi, dtype: int64
Latest calving-front mask
The calving-front file contains multiple times, for the this notebook we only select only the latest timestamp and then rasterise it.
calving_gdf = gpd.read_parquet(SOURCES["calving_fronts_parquet"], storage_options=S3_OPTIONS)
calving_gdf["time"] = pd.to_datetime(calving_gdf["time"])
latest_time = calving_gdf["time"].max()
latest_calving = calving_gdf.loc[calving_gdf["time"] == latest_time]

calving_clipped = clip_to_aoi(latest_calving)
calving_mask = rasterize_mask(calving_clipped, name="calving_front_mask")
calving_mask.attrs["selected_time"] = latest_time.isoformat()

print(f"calving_front_mask: {len(calving_clipped):,} latest features intersect the AOI")
calving_mask
calving_front_mask: 1 latest features intersect the AOI
Surface elevation change layer
SEC is coarser than the target grid. Interpolate the continuous fields with linear and the class field with nearest.
sec = open_remote_zarr(SOURCES["sec_zarr"])
sec_latest = sec[["sec", "sec_uncertainty", "surface_type"]].isel(time=-1)
sec_latest = sec_latest.set_index({"x": "x", "y": "y"}).drop_vars(["lon", "lat"])

sec_roi = (
    sec_latest
    .sortby("x")
    .sortby("y")
    .sel(x=slice(left - 10_000, right + 10_000), y=slice(bottom - 10_000, top + 10_000))
)

sec_continuous = interpolate_to_grid(sec_roi[["sec", "sec_uncertainty"]], method="linear")
sec_continuous = sec_continuous.rename(
    {
        "sec": "surface_elevation_change_rate",
        "sec_uncertainty": "surface_elevation_change_uncertainty",
    }
)

sec_surface = interpolate_to_grid(sec_roi["surface_type"], method="nearest")
sec_surface = sec_surface.round().fillna(0).astype("uint8").rename("surface_elevation_change_surface_type")

sec_layer = xr.merge([sec_continuous.astype("float32"), sec_surface.to_dataset()])
sec_layer
/tmp/ipykernel_21488/3364620909.py:23: FutureWarning: In a future version of xarray the default value for compat will change from compat='no_conflicts' to compat='override'. This is likely to lead to different results when combining overlapping variables with the same name. To opt in to new defaults and get rid of these warnings now use `set_options(use_new_combine_kwarg_defaults=True) or set compat explicitly.
  sec_layer = xr.merge([sec_continuous.astype("float32"), sec_surface.to_dataset()])
Ice velocity layer
Select the velocity data closest to the requested date, interpolate the easting/northing components, and recompute speed on the target grid.
velocity_names = [
    "land_ice_surface_easting_velocity",
    "land_ice_surface_northing_velocity",
]

velocity = open_remote_zarr(SOURCES["ice_velocity_zarr"])
velocity = velocity.set_index({"x": "x", "y": "y", "time": "time"})
velocity_time_slice = velocity[velocity_names].sel(time=VELOCITY_TIME_TARGET, method="nearest")

velocity_roi = (
    velocity_time_slice
    .sortby("x")
    .sortby("y")
    .sel(x=slice(left - 2_000, right + 2_000), y=slice(bottom - 2_000, top + 2_000))
)

velocity_layer = interpolate_to_grid(velocity_roi, method="linear")
velocity_layer = velocity_layer.rename(
    {
        "land_ice_surface_easting_velocity": "ice_velocity_easting",
        "land_ice_surface_northing_velocity": "ice_velocity_northing",
    }
).astype("float32")

velocity_layer["ice_velocity_magnitude"] = np.hypot(
    velocity_layer["ice_velocity_easting"],
    velocity_layer["ice_velocity_northing"],
).astype("float32")

selected_velocity_time = pd.to_datetime(velocity_time_slice["time"].values).strftime("%Y-%m-%d")
velocity_layer.attrs.update(source_type="zarr", interpolation_method="linear", selected_time=selected_velocity_time)
velocity_layer
11. Ice temperature layer
The temperature dataset is curvilinear: it stores latitude and longitude arrays rather than regular x, y coordinates. Project those source points to EPSG:3031, then assign each target cell the nearest source value.
ice_temp = open_remote_zarr(SOURCES["ice_temperature_zarr"])

depth_values = np.asarray(ice_temp["depth"].values)
temperature_depth_index = int(np.nanargmin(np.abs(depth_values - ICE_TEMPERATURE_DEPTH_M)))
temperature_depth_m = float(ice_temp["depth"].isel(depth=temperature_depth_index).values)

temperature_k = curvilinear_nearest_to_grid(
    ice_temp["Tice"].isel(depth=temperature_depth_index).values,
    ice_temp["longitude"].values,
    ice_temp["latitude"].values,
    name="ice_temperature",
)

temperature_k.attrs.update(
    long_name="Ice sheet temperature",
    units=ice_temp["Tice"].attrs.get("units", "K"),
    source_type="curvilinear_zarr",
    selected_depth_m=temperature_depth_m,
)

temperature_layer = temperature_k.to_dataset()
temperature_layer
3. Merge and write the cube
All layers now share the same coordinates. Merge them into one dataset, add CRS metadata, and write a local Zarr cube.
cube_parts = [
    bed_layer,
    basal_melt.to_dataset(),
    sec_layer,
    velocity_layer,
    temperature_layer,
    calving_mask.to_dataset(),
    *[layer.to_dataset() for layer in vector_layers],
]

cube = xr.merge(cube_parts, compat="override")
cube["spatial_ref"] = TARGET_TEMPLATE["spatial_ref"]

for name, da in cube.data_vars.items():
    if name != "spatial_ref":
        da.attrs.setdefault("grid_mapping", "spatial_ref")

cube.attrs.update(
    title="Sample datacube",
    crs=TARGET_CRS,
    target_resolution_m=TARGET_RESOLUTION_M,
    aoi_center_x_m=AOI_CENTER_XY_M[0],
    aoi_center_y_m=AOI_CENTER_XY_M[1],
    aoi_width_m=AOI_WIDTH_M,
)

OUTPUT_DIR.mkdir(parents=True, exist_ok=True)
chunks = {dim: min(size, 256) for dim, size in cube.sizes.items() if dim in {"y", "x"}}

with ProgressBar():
    cube.chunk(chunks).to_zarr(FINAL_CUBE, mode="w", consolidated=True, zarr_format=2)

cube
[########################################] | 100% Completed | 154.18 s
# Open the written Zarr store to check the final variables and metadata.
demo_cube = xr.open_zarr(FINAL_CUBE, consolidated=True)
demo_cube
import cartopy.crs as ccrs
import cartopy.feature as cfeature
import matplotlib.pyplot as plt
from matplotlib.colors import ListedColormap

antarctic_crs = ccrs.SouthPolarStereo(central_longitude=0, true_scale_latitude=-71)

plot_specs = {
    "bedrock_elevation": {"title": "Bedrock elevation", "cmap": "terrain", "label": "m", "robust": True},
    "ice_shelf_basal_melt_rate": {"title": "Ice-shelf basal melt rate", "cmap": "RdBu_r", "label": demo_cube["ice_shelf_basal_melt_rate"].attrs.get("units", ""), "robust": True},
    "surface_elevation_change_rate": {"title": "Surface elevation change rate", "cmap": "RdBu_r", "label": demo_cube["surface_elevation_change_rate"].attrs.get("units", ""), "robust": True},
    "ice_velocity_magnitude": {"title": "Ice velocity magnitude", "cmap": "viridis", "label": demo_cube["ice_velocity_magnitude"].attrs.get("units", ""), "robust": True},
    "ice_temperature": {"title": "Ice temperature", "cmap": "coolwarm", "label": "degC", "robust": True},
    "grounding_line_mask": {"title": "Grounding-line mask", "cmap": ListedColormap(["#111827"]), "label": "mask", "robust": False},
}

plot_vars = list(plot_specs)
left_plot = float(demo_cube.x.min())
right_plot = float(demo_cube.x.max())
bottom_plot = float(demo_cube.y.min())
top_plot = float(demo_cube.y.max())
pad_x = (right_plot - left_plot) * 0.08
pad_y = (top_plot - bottom_plot) * 0.08

fig, axes = plt.subplots(
    2,
    3,
    figsize=(16, 10),
    subplot_kw={"projection": antarctic_crs},
    constrained_layout=True,
)

for ax, name in zip(axes.ravel(), plot_vars):
    spec = plot_specs[name]
    da = demo_cube[name]

    if name == "ice_temperature":
        da = da - 273.15
        da.attrs["units"] = "degC"

    if name.endswith("_mask"):
        da = da.where(da > 0)

    ax.set_xlim(left_plot - pad_x, right_plot + pad_x)
    ax.set_ylim(bottom_plot - pad_y, top_plot + pad_y)
    ax.add_feature(cfeature.OCEAN, facecolor="#dbeafe", zorder=0)
    ax.add_feature(cfeature.LAND, facecolor="#f8fafc", edgecolor="#94a3b8", zorder=1)
    ax.add_feature(cfeature.COASTLINE, linewidth=0.7, color="#475569", zorder=2)
    ax.gridlines(draw_labels=False, linewidth=0.35, color="#64748b", alpha=0.45, zorder=3)

    da.plot(
        ax=ax,
        transform=antarctic_crs,
        cmap=spec["cmap"],
        robust=spec["robust"],
        add_colorbar=True,
        cbar_kwargs={"label": spec["label"], "shrink": 0.78, "pad": 0.03},
        alpha=0.88 if not name.endswith("_mask") else 0.95,
        zorder=4,
    )

    ax.set_title(spec["title"], fontsize=12, weight="semibold")
    ax.set_xlabel("")
    ax.set_ylabel("")
    ax.set_aspect("equal")

fig.suptitle("Merged 200 m EPSG:3031 demonstration cube", fontsize=15, weight="bold")
plt.show()
/home/krasen/micromamba/envs/pangeo/lib/python3.13/site-packages/cartopy/mpl/feature_artist.py:144: UserWarning: facecolor will have no effect as it has been defined as "never".
  warnings.warn('facecolor will have no effect as it has been '
/home/krasen/micromamba/envs/pangeo/lib/python3.13/site-packages/cartopy/mpl/feature_artist.py:144: UserWarning: facecolor will have no effect as it has been defined as "never".
  warnings.warn('facecolor will have no effect as it has been '
/home/krasen/micromamba/envs/pangeo/lib/python3.13/site-packages/cartopy/mpl/feature_artist.py:144: UserWarning: facecolor will have no effect as it has been defined as "never".
  warnings.warn('facecolor will have no effect as it has been '
/home/krasen/micromamba/envs/pangeo/lib/python3.13/site-packages/cartopy/mpl/feature_artist.py:144: UserWarning: facecolor will have no effect as it has been defined as "never".
  warnings.warn('facecolor will have no effect as it has been '
/home/krasen/micromamba/envs/pangeo/lib/python3.13/site-packages/cartopy/mpl/feature_artist.py:144: UserWarning: facecolor will have no effect as it has been defined as "never".
  warnings.warn('facecolor will have no effect as it has been '
/home/krasen/micromamba/envs/pangeo/lib/python3.13/site-packages/cartopy/mpl/feature_artist.py:144: UserWarning: facecolor will have no effect as it has been defined as "never".
  warnings.warn('facecolor will have no effect as it has been '