This notebook opens a WAPOSAL Zarr product, inspects trajectory metadata, and plots a selected track on a map.
import xarray as xr
data_url = 'https://s3.waw4-1.cloudferro.com/EarthCODE/OSCAssets/waposal/MT-S3A.zarr'
ds = xr.open_zarr(data_url, decode_times=False, zarr_format=2)
ds
Loading...
ds.trajectory_info.valuesarray(['P_RES_S3A_SR_1_SRA_A__20160313T200006_20160313T200020_20180203T001443_0013_002_014_GPOD_SAR_R_NT_003.nc',
'P_RES_S3A_SR_1_SRA_A__20160406T080605_20160406T085634_20180203T005835_3029_002_349_GPOD_SAR_R_NT_003.nc',
'P_RES_S3A_SR_1_SRA_A__20160406T094704_20160406T103733_20180203T012114_3029_002_350_GPOD_SAR_R_NT_003.nc',
...,
'P_RES_S3A_SR_1_SRA_A__20221231T100948_20221231T110018_20230126T130756_3029_094_008_GPOD_SAR_O_NT_004.nc',
'P_RES_S3A_SR_1_SRA_A__20221231T192514_20221231T201544_20230126T213108_3029_094_013_GPOD_SAR_O_NT_004.nc',
'P_RES_S3A_SR_1_SRA_A__20221231T210613_20221231T215642_20230126T230552_3028_094_014_GPOD_SAR_O_NT_004.nc'],
shape=(10339,), dtype='<U103')import matplotlib.pyplot as plt
import cartopy.crs as ccrs
import cartopy.feature as cfeature
trj_indx = 3
lons = ds.isel(trajectory=trj_indx)['longitude_20Hz'].compute()
lats = ds.isel(trajectory=trj_indx)['latitude_20Hz'].compute()
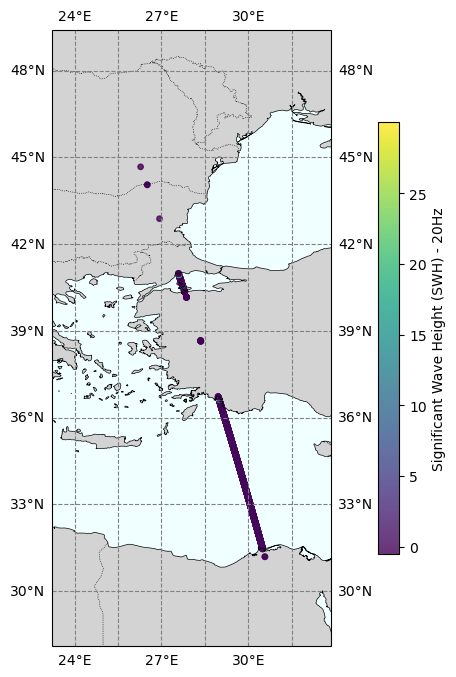
data_to_plot = ds.isel(trajectory=trj_indx)['SWH_20Hz'].compute()
fig = plt.figure(figsize=(12, 8))
ax = plt.axes(projection=ccrs.PlateCarree())
ax.add_feature(cfeature.LAND, facecolor='lightgray')
ax.add_feature(cfeature.OCEAN, facecolor='azure')
ax.add_feature(cfeature.COASTLINE, linewidth=0.5)
ax.add_feature(cfeature.BORDERS, linestyle=':', linewidth=0.5)
ax.gridlines(draw_labels=True, dms=True, x_inline=False, y_inline=False, color='gray', linestyle='--')
scatter = ax.scatter(
lons, lats,
c=data_to_plot,
cmap='viridis',
s=15,
transform=ccrs.PlateCarree(),
alpha=0.8
)
cbar = plt.colorbar(scatter, ax=ax, orientation='vertical', pad=0.05, shrink=0.7)
cbar.set_label('Significant Wave Height (SWH) - 20Hz')
ax.set_extent([
lons.min() - 2, lons.max() + 2,
lats.min() - 2, lats.max() + 2
], crs=ccrs.PlateCarree())
plt.show()