With our workflow successfully created as an openEO User Defined Process (UDP) in our previous tutorial, we can now set up an experiment. This involves executing the workflow with a predefined set of input parameters. By specifying parameters such as the area of interest and time range, we can tailor the experiment to generate meaningful results.
Running the experiment will produce output products, which will be displayed at the end of the notebook. These results can then be further analyzed, shared with the scientific community, or published in the EarthCODE Open Science Catalogue to promote reproducibility and collaboration.
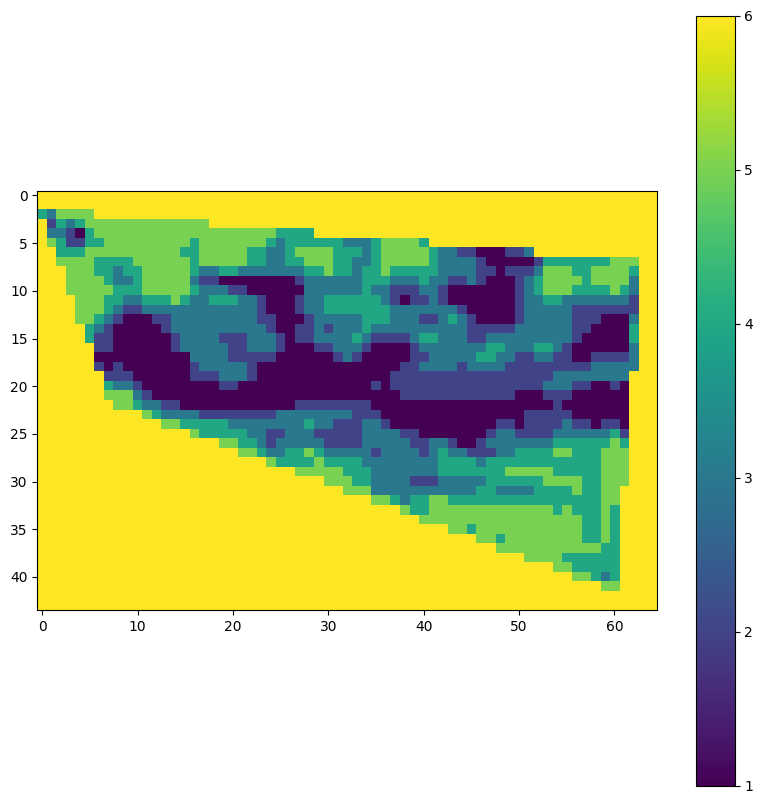
import rasterio
import matplotlib.pyplot as plt

def visualise_tif(path: str):
    with rasterio.open(path) as src:
        data = src.read(1)  # Read the first band
        plt.figure(figsize=(10, 10))
        plt.imshow(data, cmap='viridis')
        plt.colorbar()
        plt.show()
Connection with CDSE openEO Federation
The first step, before creating the experiment in openEO, is to authenticate with an available openEO backend. In this example, we will use the CDSE openEO federation, which provides seamless access to both datasets and processing resources across multiple federated openEO backends.
import openeoconnection = openeo.connect(url="openeofed.dataspace.copernicus.eu").authenticate_oidc()Authenticated using refresh token.
Setting up the experiment
In this step, we will set up the experiment by defining the parameters for the variability map calculation. This includes specifying the area of interest, the time range, and any other relevant parameters that are required for the processing workflow. The experiment will be executed using the UDP from previous tutorial which yielded a public URL that can be used to execute the workflow. We will use this URL to set up our experiment, ensuring that the processing steps are applied correctly to the specified input data.
workflow_url = "https://openeo.dataspace.copernicus.eu/openeo/1.1/processes/u:6391851f-9042-4108-8b2a-3dd2e8a9dd0b/variability_map" spatial_extent_value = {
"type": "FeatureCollection",
"features": [
{
"type": "Feature",
"properties": {},
"geometry": {
"coordinates": [
[
[
5.170043941798298,
51.25050990858725
],
[
5.171035037521989,
51.24865722468999
],
[
5.178521828188366,
51.24674578027137
],
[
5.179084341977159,
51.24984764553983
],
[
5.170043941798298,
51.25050990858725
]
]
],
"type": "Polygon"
}
}
]
}
date_value = "2025-05-01"We can now execute our experiment using the datacube_from_process function and the information from the workflow we created:
process_id: the ID that we have assigned to our workflownamespace: the public URL of the workflow, which is provided as output of thesave_user_defined_processcall**kwargs: the parameters of the workflow. If a parameter is not specified, its default value will be used
varmap_experiment = connection.datacube_from_process(
    process_id="variability_map",
    namespace=workflow_url,
    spatial_extent=spatial_extent_value,
    date=date_value
)
Now that we have created our experiment, we can explore how it is defined within openEO.
from IPython.display import JSON

JSON(varmap_experiment.to_json())Now that we have created our experiment, we can execute it by submitting it as an openEO batch job to the backend. This will trigger the processing workflow defined in our UDP, applying it to the specified input data. The output will be saved to a specified path, which we can then visualize or analyze further.
path =  "./files/varmap_experiment.tiff"
varmap_experiment.execute_batch(
    path,
    title="CDSE Federation - Variability Map Experiment",
    description="This is an example experiment from CDSE containing the calculation of a variability map in Belgium",
)visualise_tif(path)