xcube is an open-source Python framework for working with Earth Observation data as analysis-ready data cubes. In this hackathon, it connects data sources to the analysis you run in DeepESDL.
You do not need to learn every xcube component before starting. The useful mental model is:
Use a data store to find and open a dataset.
Subset and prepare it for your question—for example by variable, area, temporal sampling, projection, or resolution.
Combine and harmonize multiple datasets with xcube-multistore.
Analyse and visualise the resulting cube in a notebook or xcube Viewer.
Use xcube data stores
xcube data stores provide one interface for datasets held in different services, formats, and storage systems. A store can return an xarray.Dataset or another suitable data object while hiding source-specific access details. Data are often loaded lazily, so you can work with datasets larger than memory.
For finding and opening data, the main operations are:
list_data_ids()to enumerate available datasets;describe_data(data_id)to inspect dataset metadata;search_data(...)to find datasets using their metadata;get_open_data_params_schema(data_id)to check the supported open parameters; andopen_data(data_id, ...)to open a dataset.
Mutable stores, such as the file and s3 stores, can also write data. Both support formats such as Zarr and NetCDF. Prefer Zarr for regular data-cube outputs because it supports chunked, cloud-friendly access. Use local storage only for small explorations; use the shared team S3 storage by default for outputs you want to retain or share.
The main write-store operations are:
write_data(dataset, data_id, ...)to write a dataset.delete_data(data_id)to permanently delete a dataset—use this with care.
For the full interface, see the xcube data-access documentation. The DeepESDL data guide describes data available on the platform.
Start with DeepESDL examples
DeepESDL provides both pre-generated cubes in object storage and on-demand access through xcube data stores. Start with examples in the DeepESDL notebook catalogue.
Some examples for data access:
Some examples of how to use shared team storage:
Explore and visualise datasets
After saving a dataset to team storage, you can use the built-in xcube Viewer to inspect it interactively. You can work with the viewer directly in a notebook. A deployed example is the DeepESDL Data Viewer. The Visualise data with xcube Viewer notebook shows how to open a dataset and create an interactive visualisation.
For more customised visualisations, you can also create your own plots and dashboards using Python libraries such as Matplotlib and Plotly.
Combine data with xcube-multistore
For questions that require several sources, xcube-multistore creates a multi-source data store with a unified data model. It builds on xcube data-store plugins and xcube-resampling to make data fusion more transparent and reproducible through configuration.
Typical workflow:
Access one or more datasets through xcube data stores.
Harmonise them by subsetting, resampling, or reprojecting them as needed.
Optionally fuse them into a single cube, or keep a catalogue of aligned datasets.
The result is either one data cube on a consistent grid or a catalogue of separate, consistently described datasets.
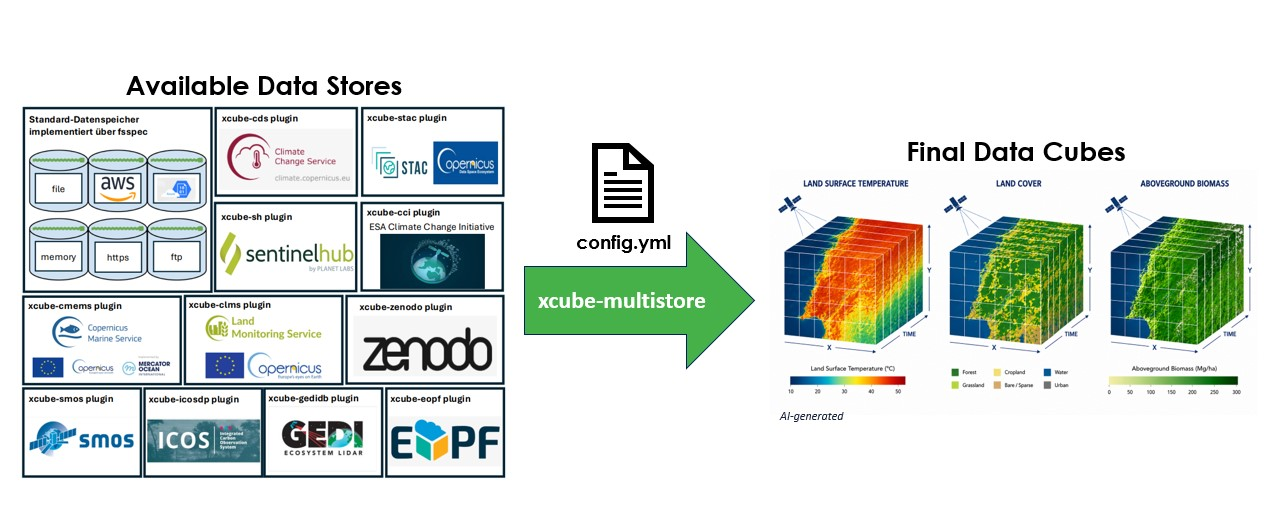
For a concrete workflow, start with the data-extraction example and use the how-to guides to adapt the configuration. Guidance on setting up a configuration file is provided in the Setup Config YAML File notebook.
Summary of resources
NoR webinar: the xcube ecosystem: end-to-end example of data access, manipulation, persistance, and exploration/ visualization.
EOPF webinar: xcube-eopf plugin: end-to-end example for new EOPF Sentinel-2 Zarr Samples.